The Customer Effort Score has got a lot of airplay – claiming to be the only customer service metric that you would need.
In this article, Guy Fielding looks at these claims and finds that although Customer Effort is a good supporting indicator, it cannot be used as the primary customer service metric.
In summer 2010, when Dixon, Freeman and Toman published their HBR paper “Stop trying to delight your customers”, they not only offered hard-pressed customer service people a tantalising hint of a less demanding service standard, they also made some strong claims for the pre-eminence of Customer Effort as an alternative to both Customer Satisfaction and the Net Promoter Score as the metric by which service operations should be measured and managed. Based on a study of data from 75,000 customers and structured interviews with customer service leaders, they claimed to have shown that:
- Exceeding expectations during service interactions had negligible impact on customer loyalty.
- Instead, customer loyalty was primarily the result of service interactions which minimised customer effort
- In the customer service environment, Customer Satisfaction (CSat) was a weak predictor of customer loyalty, Net Promoter Score (NPS) was slightly better, but Customer Effort Score (CES) had the highest predictive power.
A win–lose debate
In their paper Dixon et al. structure the differences between Customer Effort and other measures as a win–lose debate, with the goal of making things easy for the customer simply replacing the need to satisfy (CSat) or delight (NPS) the customer.
Their paper undoubtedly had, and continues to have, a major impact within contact centres. However, we believe that the validity of their argument and resultant claims have not been properly examined.
The need to be cautious
There are a number of grounds to be cautious before accepting the CE proposition. Some of them are to do with how that argument is made:
- It is difficult to find out how they define and measure Customer Effort. For instance, they gloss CE as “helping them (i.e. customers) solve their problems quickly and easily”. In doing this they confound effort (“easily”) not only with speed (“quickly”) but also with resolution (“solve”).
- They provide no information about how CE was measured in practice.
- In their paper they don’t report any data (even the axes of graphs have no units specified) and they give no details of the results of their statistical analyses. This makes it very difficult to assess the validity and power of their claims (and note that HBR is not a peer-reviewed journal).
- They define loyalty as a combination of repurchasing and increased spending by the customer, but in practice it seems that loyalty was measured simply by asking customers what they thought they would do, clearly not the same thing at all.
Can these results be replicated?
Whilst these concerns might make us cautious, the more important test of the Customer Effort Score’s claims is whether their results can be replicated. Since 2010 horizon2 have conducted a number of large-scale studies of UK customer service operations, including:
- the inbound in-house customer services operation of a very large UK retail banking operation
- the inbound in-house complaint resolution operation of a large UK general retailer
- an outsourced inbound technical support operation for a large UK media provider.
In these studies we have found a consistent pattern of results which both supports and challenges the Customer Effort Score’s claims.
A clear relationship between Customer Effort and outcomes
We measured Overall Customer Effort (on a 9pt scale) and there was a clear and consistent relationship between CE and customers’ evaluations and intentions. For instance:
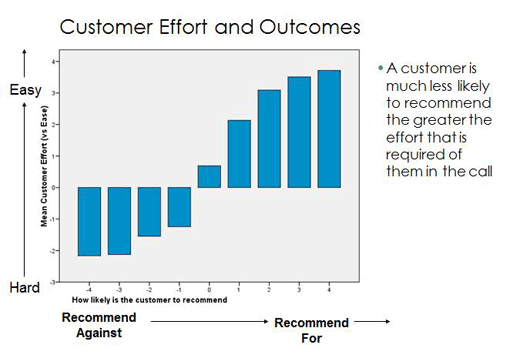
We also identified a large number of events and activities that might possibly contribute to Overall Customer Effort. For instance:
- dealing with a complex IVR (lots of menus, lots of choices)
- completing (and having to repeat) a complex ID&V procedure
- being asked to repeat information within the call
- talking with agents who use jargon
- being in conversations with a high incidence of interruptions/ simultaneous talk.
A significant relationship
In each case we tested whether there was a significant relationship between this item and Overall Customer Effort, and also whether this problem occurred rarely or frequently. This is important because to make use of the Customer Effort concept you have to know:
- which process elements actually increase/decrease (perceived) Customer Effort
- how powerful each of those process elements is
- and how much grief they are currently causing.
To improve things you need to know:
- where and why these issues are occurring
- and how they can be fixed.
And then of course you have to change things.
Our analyses demonstrate that lots of things in the service interaction influence perceived Customer Effort, and that CE provides a powerful simplifying principle, a design imperative, and a management (and agent) objective (“let’s make things as easy as possible”).
The Customer Effort Score’s claim to pre-eminence
Our analyses also showed that the claim of pre-eminence made for Customer Effort cannot be sustained. Across a series of studies we showed that the best predictor of customer evaluations and intentions was never a single measure of Customer Effort, but instead was a combination of metrics, one of which was CE, but which always included other factors.
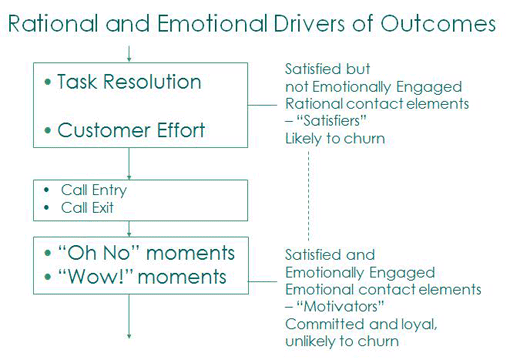
Using a statistical technique called linear (multiple) regression, we have shown that customers consider the following factors:
- Task resolution
- Customer Effort
- “Oh no” moments
- “Wow!” moments
- Call entry
- Call exit.
Customer Effort is not the most powerful predictor
Predictive models taking these factors into account have r-squared values (which indicate the relative predictive power of the model) of 0.8 to 0.9, which account for some 80%+ of the variance in the target outcome variable. In every case we found that, although Customer Effort added significantly to a model’s predictive ability, it was never the most powerful predictor in the model. And in every case we found that other variables, in particular the Judgemental Heuristics-related metrics also increased the predictive power of the model.
We defined Task Resolution from the customer/caller’s point of view: “At the end of the call, to what extent had the customer achieved what they had hoped to and/or expected to achieve when they initiated the call?” Note that this is NOT the same as defining/measuring Task Resolution from the organisation’s point of view. Across a range of purposes and tasks, organisationally defined and customer-defined Task Resolution are often quite different.
Common-sense evaluation
The combination of Task Resolution and Customer Effort drive the customer’s rational (and “common-sense”) evaluation of the call.
If the call solves their problem then, other things being equal, it’s a good call. If the call doesn’t, then it’s a poor call. If achieving that task resolution was easy, then the customer is likely to think it’s an even better call, whereas if achieving that task resolution was hard work then they are likely to think it wasn’t quite as good.
Similarly, if the task was not resolved but realising that that was going to be the case was relatively painless then it won’t be considered a very bad experience, but if the customer has to work hard and still doesn’t get their task completed then they are going to think very poorly of that interaction.
Our future behaviours are not entirely rational
However, these analyses show that when we evaluate our experiences and determine our future behaviours we are not entirely rational. We have identified a series of elements within service interactions which have a disproportionate impact on the customer’s evaluation of that encounter, and on their future behaviour.
We term these elements “Judgemental Heuristics”. They are the “rules of thumb” that people use to short-cut the processing of lots of information.
The factors that matter
We have found that the following are consistently powerful within service interactions:
Contact entry: technically known as the Primacy Effect; first impressions count
Contact exit: technically known as the Recency Effect; the most recent impression also counts
“Wow” events: events which surprise and delight, peak experiences, memorable moments
“Oh no” events: events which are negative, when things go wrong, service delivery failures, unpleasant and aversive interactions, etc.
These components of the service interaction, when they occur, are very powerful.
The Emotional Glue
They form the “emotional glue” which can engender customer loyalty, or they can constitute the “emotional landmine” that destroys the organisation’s relationship with the customer. They do not appear to have been included as metrics in the Customer Effort Score’s study, so clearly their importance could not be properly assessed.
However, it is also the case that service organisations are so arranged that their importance can be overlooked. In general, contact entry is a highly structured and invariant part of the interaction. It is also remarkably similar across lots of different organisations. As such, because there is little variation it is difficult for the power of this variable to be detected by statistical analyses which look for the relation of one difference to another. It is also the case, in our experience, that the typical contact entry is, from the customer’s point of view, pretty unattractive and is therefore unlikely to engender positive evaluations and subsequent loyalty. But that doesn’t mean that, in principle, great entries couldn’t be designed, and when they happened, they would have a big positive impact on the customer’s contact experience.
Not with a bang but with a whimper
Exactly the same can be said of most contact exits. They are usually formulaic and pretty uninspiring: most contacts end “not with a bang but with a whimper”.
The rather sad fact is that “Wow” moments occur very rarely in service encounters, in part at least because they depend on agents responding to the particularities of the customer and the situation, and organisations go to enormous efforts to “manage out” such variation.
Similarly, organisations try to avoid “Oh no” moments, but unfortunately they are much less successful at doing this, and indeed their efforts to impose consistency on the encounter often cause rather than avoid “Oh no” moments.
Summary

Guy Fielding
In a series of empirical studies of UK service operations we have shown that:
- Customer Effort is a powerful driver of customer experience and future behaviour.
- But Customer Effort is not the only driver, and other rational drivers, such as Task Resolution, and emotional drivers, such as Judgemental Heuristics, are as powerful, if not more powerful.
- If we are going to improve the service encounter then we cannot focus on just one element of what is a complex phenomenon, but instead must develop and make use of appropriately subtle understandings to guide our design and delivery of these customer interactions.
Guy Fielding is Director of Research at horizon2
Author: Jo Robinson
Published On: 18th Apr 2012 - Last modified: 31st Mar 2023
Read more about - Customer Service Strategy, Customer Effort, Customer Satisfaction (CSAT), CX, Measurement, Metrics, NetPromoter Score (NPS)









Readers,
Please read the HBR document before you take this article to heart. Many of the critiques made in this article could also be said about the information Guy Fielding provides.
CES is not the end all, but neither is NPS or CSAT. Any measurement of Customer Loyalty will need to be looked at from multiple angles. Why do they feel this way? Are there certain types of calls that cause a lower NPS, lower CSAT, higher CE?
[part of post removed by moderator]
I agree with the first post – well worth reading the CES article before reading the article by Guy
CES is just another measure, a good one at that. But the key thing with any measures is how your turn data, to information and that knoweldge that you can use to drive customer experience in my humble opinion
Good well structured article that adds to the debate on Customer Effort Score. I think it’s important to note that Dixon et al (and many commentators) point out that whilst CES is a better determinant measure of customer loyalty it augments other sat measures. No mention in this article of the impact of failure demand – no matter if you adopted all of the above measures to deliver a great “experience” for your callers and enable them to achieve FCR – they would still be irritated (emotional impact on loyalty) at being needlessly forced to contact a service provider to correct their service failure!
Hi all,
I just have one question about the customer effort score calculation , we have IVR survey with question from 1 to 7 score , so the final formula will same as the NPS ( Easy- difficulties) divide by the total response .