We investigate the mysterious metric of contact centre spin and explain why it can be such a headache for contact centre planners.
What Is Contact Centre Spin?
Contact centre spin is the percentage of abandoned callers who will recontact you.
Contact centre spin is the percentage of abandoned callers who will recontact you.
Many contact centres will calculate how a variance in abandon rate will impact spin to reduce volatility in future forecasts.
This can be difficult, though, because there is no one-size-fits-all answer, as spin will change drastically from business to business and contact reason to contact reason.
Of course, the obvious answer is to plan so that spin doesn’t happen in the first place, but no matter how well you plan, sometimes service level will vary, causing abandon rates and spin to change too. Spin can therefore be an important consideration.
So let’s take a look at how some contact centres are calculating spin.
Calculating Contact Centre Spin
The formula for contact centre spin is:

To calculate spin and use this formula, you will typically have to use the caller IDs in your Call Detail Records from your ACD system to track repeat calls – focusing specifically on those who had abandoned their previous call.
For a more accurate calculation, you would need to track abandoned customers to see if they used a different channel to find a resolution after their original call was abandoned.

Phil Anderson
Phil Anderson, Director of The Forum, also recommends: “If the data is available, take a look at a sample day and then develop your hypothesis to test a larger sample size. Just be aware of historical events and future changes.”
With research like this, we can create a “Rule of Thumb” model for contact centre spin that looks like a more sophisticated version of the following:
- Less than 5% Abandoned – No spin
- 5–10% Abandoned – 33% of Those Who Abandoned are Spin
- 10–20% Abandoned – 50% of Those Who Abandoned are Spin
- 20%+ Abandoned – Panic!
It is also important to spot trends in how long people will take to contact for a second time, so you can account for volatility and potentially readdress future forecasts.
Important Contact Centre Spin Calculation Considerations
As we previously alluded to, if you have a variety of self-service options, the customer may choose to use these after abandoning, resulting in them no longer needing to contact you. This is just one of the many important spin considerations.
In addition to the quality of your available data, being able to calculate spin depends greatly on your ability to identify the second contact from the same customer via any method.
How do you know that this second contact concerns the same issue? It might therefore not be spin…
But how do you know that this second contact concerns the same issue? It might therefore not be spin but may be a new contact reason.
“It is often the case that people assume that if a customer is contacting you more than once within X period of time, then it must be a repeat contact, regardless of the reason for the second contact. This can easily over-inflate your demand profile and lead to overstaffing,” says Adam, one of our readers.
Also, you must also consider how long the impact of high abandon rates, and therefore spin, will last. This needs to be a key factor in your model.
For example, you may receive the spin contacts in a fashion like the graph below.
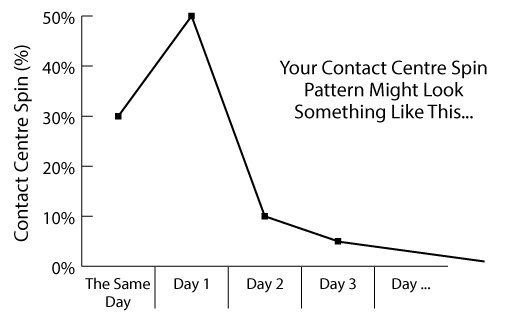
- 30% of your spin contacts later that day
- 50% of your spin contacts the next day
- 10% of your spin contacts two days later
- 5% of your spin contacts three days later
- 5% of your spin contacts four to seven days later
Generally, spin is a very quick curve over the next seven days following a period of high abandonment. Yet spin becomes much more of a problem when abandon rates are consistently high.
Find out how to calculate abandon rates in our article: How to Measure Call Abandon Rate
How to Lower the Negative Impact of Contact Centre Spin
High contact centre spin is usually caused by unexpectedly high contact volumes or spikes in absenteeism that cause high abandon rates.
When abandon rates spike, contact centre spin increases, this negatively impacts your future forecasts in two ways:
- You understaff for the next few days, as spin calls are added on top of your forecast contact volumes.
- You overstaff in the future, as spin calls distort historical call volumes.
So, if you want to control spin, you need to lower abandon rates.
As Will Boswell, a contact centre consultant, says: “I think it very much depends on the customer, their past experience, messaging in IVR (e.g. are they hearing a lazy message just telling them they will wait a long while when in actual fact it may be three minutes, but they then hang up after 30 seconds) and the alternative choices that the customer has.”
Of course, improving your forecasting ability also plays a big part in this – but there are a number of other things that you can do. These include:
- Increase Your Ring Time – As soon as customers call you, you may immediately play an automated message, but if you add a few rings before the automated message, you can add a few vital seconds before callers give up and abandon.
- Test Your Queue Messages and Hold Music – Your messaging and hold music has a big impact on when customers decide to abandon. So, run some tests with different voices, message frequency and music to see how it impacts how long customers are willing to wait in the queue.
- Examine Your Call Abandon Curves – You plot abandon curves to examine the relationship between abandon rate and hold time. By plotting this out on a graph, you can identify weak points in your hold strategy and adjust them accordingly.
These strategies can really work in terms of reducing the impact of contact centre spin and reducing future contact volumes, according to Will Boswell.
“One recent experience with a past client is that they removed 20% of offered call volume by managing abandon rate down from a historic 10% to delivering inside 4% each day,” says Will.
For more advice on how to lower abandon rate and therefore the impact of contact centre spin, read our article: How to Bring Down Your Call-Abandon Rates
A Different Approach to Measuring Contact Centre Spin
Of course, as spin impacts different organizations in different ways, there is no standard formula that is easy to use. So, there are many different methods for calculating contact centre spin out there.
The key is to create a model for your contact centre using figures from the Caller Line ID (CLI) by comparing the abandoned CLIs with those that have called back within a certain period of time.
What constitutes a reasonable length of time to assume the customer is calling about the same problem will vary from one organization to another.
So far, this is the standard approach. But one contact centre reached out to those callers who hadn’t called back over a sample time period to see why they had chosen not to call back, while offering good customer service.
Of course, this requires extra capacity to call back, but this contact centre was able to create a more accurate model for contact centre spin, according our reader Karl, who oversaw the implementation of this strategy.

It’s also possible to determine whether the customer has managed to get what they needed through another channel…
“In businesses with a good grasp of their process and associated data model, it’s also possible to determine whether the customer has managed to get what they need through another channel and therefore doesn’t need to call back,” adds Karl.
This approach shifts the focus away from just the metric and puts the customer at the centre. Having that understanding of the human behaviours behind the figures in workforce management (WFM) is something that is often overlooked.
For more general tips on running a great WFM programme, read our article: 50 Expert Tips to Improve Contact Centre WFM
Final Thoughts
Contact centre spin has no one-size-fits-all formula. It requires each contact centre to create its own model, as spin figures will vary based on your self-service offerings, their ease of use and also – more significantly – your business sector.

Phil Jennings
For example: “Take insurance, the sales line will likely see very low spin (depending on competition etc.), as having your initial enquiry answered in a swift manner is the first test of the service you offer,” says Phil Jennings, a contact centre planning manager.
“The claims line could have close to 100% spin, as it is very unlikely that the customer’s claim is going to go away.”
To create your own model, you need to compare your caller line IDs with your abandon CLIs, while also tracking the activity of those who abandoned, in order to see if they bounced into another channel.
Then there are other spin considerations to think about, including when those repeat spin contacts will recur – in an hour, a day or maybe even a week?
So we can already see that there is a lot to think about when calculating contact centre spin, but we hope this article will help you on your way.
Good luck!
For more on calculating important metrics for contact centre WFM, read our articles:
- How to Calculate Contact Centre Service Level
- How to Calculate Occupancy
- How to Calculate Forecast Accuracy
Author: Robyn Coppell
Reviewed by: Megan Jones
Published On: 24th Aug 2020 - Last modified: 24th Apr 2024
Read more about - Call Centre Management, How to Calculate, Phil Anderson, Workforce Management (WFM)


