
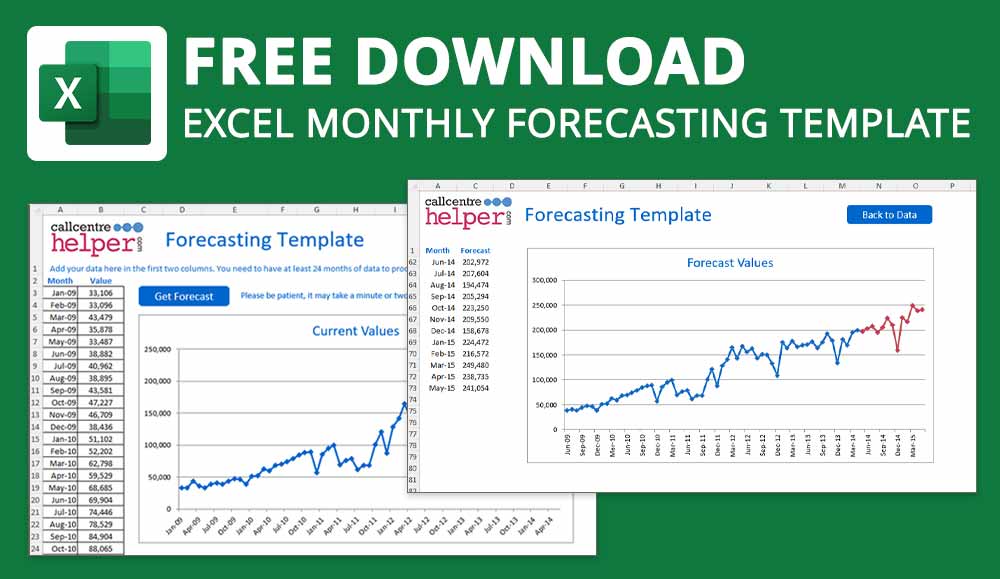

Call Centre Helper has created a free to download excel based call centre forecasting template, which will assist with capacity planning, demand and call volume forecasting processes.
Free Download – Excel Forecasting Template
Do you want to download this to use?
Get your download of the Free Excel Forecasting Template now:
Alternatively click here to try our online forecasting tool
This tool needs you to have 24 previous months of data available. You add these to the spreadsheet and it will calculate the next 12 months’ predicted values for you. If you do not have multiple years worth of data, take a look at our article: How to Forecast with Minimal Data.
Free Excel Forecasting Template Designed to Work with Call Volumes
You can then use these reports for capacity planning purposes. The forecasting template has been designed to work with call volumes, but could easily be adapted for other types of monthly forecast.
Our forecaster works using the Holt-Winters, or triple exponential smoothing, method, which assumes that there are three components to any forecast:
- A seasonal adjustment – based on previous data for the same months, e.g. you might expect customer calls to go down in December or rise in July.
- A trend – whether your values are generally growing or shrinking over time.
- A level – a baseline for your values once the other components have been removed.
Click here to download the Forecasting template
To get the calculator to work you must enable macros in Excel and have both Analysis Toolpak and Solver installed in Excel as Add-ins. You will find more instructions on checking whether they are installed and how to add them here.
If you prefer to print out the instructions you can also download the instructions here.
This explains a little about how the calculations are performed and has the instructions for installing the Add-ins and using the tool.
Video Guide for Using the Free Excel Forecasting Template
We have also created a how-to guide on YouTube, but you can watch the video below.
You are free to use the forecaster in all of your projects, provided that you do not resell or distribute the tool on the web.
If you spot any bugs in the spreadsheet or if you have any feedback please send us an email or leave details in the comments below.
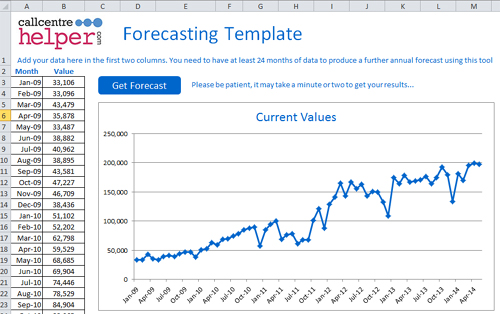
Using the Monthly Excel Forecasting Template
Open the spreadsheet and enable macros (or Enable Content) if you are prompted to do so.
If there are any problems check you have both Analysis Toolpak and Solver installed in Excel as Add-ins. You will find more instructions on checking whether they are installed and how to add them here.
You will need to have at least 24 months of data in order to produce the next 12 predicted months for call volumes. You can probably get this data from the call volume reports on the Call centre system.
When you open up the tool you will see that it has some dummy data in it, and you should be able to see a chart, with the data that feeds it to the left-hand side, starting with the oldest month in cell A3 and the oldest value in cell B3.
You can add as many values as you wish in columns A and B. Please don’t leave any gaps in the data.
You can replace the values by simply overwriting them or copying and pasting data from another spreadsheet, as long as it is the same format of date in the first column (dd/mm/yyyy) and value in the second column.
It’s best to Copy and Paste Special (Paste as Values) to be absolutely sure that you don’t inadvertently copy over any formulas from elsewhere.
If you select the current data and press the delete key, you may get the following message
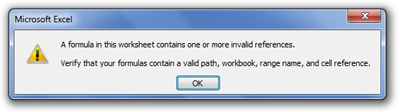
This is fine, click OK and the chart will refresh and show just one point in the centre. When you enter your new data, the chart will redraw with the data you’ve entered and everything should work.
Click the blue “Get Forecast” button and Excel will start to use Solver to find the most likely next points for your data.
You will need to be patient at this point. It can take around 20-30s for Solver to settle on a most probable solution and you will see numbers changing at the bottom left of your screen as different values are tried out.
After this time, you will be taken to the Forecast and you will see a new chart with the next 12 predicted values showing in red. The next 12 predicted months and forecast values are shown to the left of the chart.
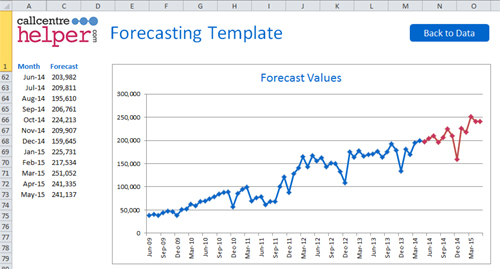
Your original data also exists in this sheet but the rows have been hidden, leaving only your forecast visible.
If you’d like to forecast call volumes even further in to the future then you could take these values and transfer them back in to the data worksheet at the end of your current data, then run the forecast again to get another 12 months. In this way you could try to forecast a few years.
Have a read of our FAQs- Call Forecasting with Spreadsheets article, for the answers to 17 common questions with forecasting with spreadsheets.
Using this Forecast for Staffing Forecasts
The forecasting spreadsheet just works out the monthly predicted call volumes. If you want to use it workforce management, for scheduling your call centre, you will need to break down the outputs into a daily and then hourly forecast.
You can then plug the numbers into an Erlang calculator to get the numbers of Agents or FTE required.
Terms and Conditions
Use of the Forecasting Spreadsheet is subject to our standard terms and conditions.
If you are looking for more excel versions of useful contact centre tools, check these out next:
- Excel Based Erlang Calculator for Contact Centres – with Maximum Occupancy
- Free Call Monitoring and Evaluation Form – Excel Template
- Contact Centre Dashboard Excel Template – FREE Download
Author: Jonty Pearce
Reviewed by: Hannah Swankie
Published On: 18th Mar 2015 - Last modified: 5th Mar 2025
Read more about - Essential Call Centre Tools, Downloads, Excel, Forecasting, Printable, Staffing, Workforce Management (WFM)