


In a busy contact centre, every call represents an opportunity to connect with a customer, so it’s important for contact centres to not only track those that are answered, but also those that aren’t.
Call Abandon Rate (also known as Call Abandonment Rate) measures the percentage of callers who hang up before reaching an agent, and is used to highlight potential issues like understaffing or lengthy wait times.
Monitoring this metric is useful because it not only reflects customer satisfaction but also pinpoints operational inefficiencies that can lead to lost business.
In this article we take a look at how to calculate Call Abandon Rate in the contact centre, looking at the formula, industry standards and much more.
What Is Call Abandon Rate?
Call Abandon Rate is a percentage measure of how many customers terminate their call before it is answered in the contact centre.
Your Call Abandon Rate will vary throughout the day, depending on service level performance and your queue strategy – i.e. on-hold messaging, hold music, IVR options etc.
What is Not Included in Call Abandonment Rate
While this definition for Call Abandon Rate is relatively straightforward, make sure that you don’t confuse call abandons with:
- Missed Calls – These are calls that are deliberately disconnected by the call centre. They can occur when an inbound call reaches the maximum wait time limit set by the centre’s ACD system.
- Dropped Calls – These are calls that are unwittingly disconnected by the call centre – usually due to a technical error. These are a one in 10,000 calls occurrence for landline calls and only slightly higher for mobile phone calls.
- Lost Calls – Abandoned calls, missed calls and dropped calls are all classed as lost calls. So a call abandon is a lost call, but a lost call isn’t necessarily an abandoned call.
- Short Calls – Short calls are when the caller hangs up moments after the advisor picks up. These are not considered to be abandoned calls.
The Call Abandon Rate Formula
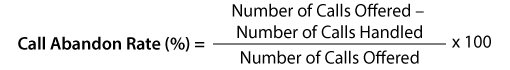
To calculate call abandonment rate you need to first subtract the number of calls handled from the number of calls offered, then divide this number by the number of calls offered, before finally multiplying the result by 100 to get a percentage.
The formula for calculating Call Abandon Rate is:
Call Abandon Rate = ((Number of Calls Offered −Number of Calls Handled) ÷ Number of Calls Offered) × 100
Example Call Abandonment Rate
So, if you have 100 calls offered and 95 are handled, you will have a 5% Call Abandon Rate.
Call Abandon Rate = ((100 −95) ÷ 100) × 100 = 5%
Your data for calculating your abandon rate will be stored in your call abandon reports within your ACD system – which should be integrated with your IVR.
But it’s not quite as easy as that. There’s even more to consider when measuring Call Abandon Rate.
Should You Include Short Call Abandon Rates in Your Formula?
It is common practice to exclude calls that abandoned in the first five seconds.
This is for two main reasons:
- The customer dials the wrong number and only realizes when the call is connected
- The customer dials the right number but thinks they may have dialled a digit incorrectly and then hangs up and redials the same number to be on the safe side
You can configure the threshold for short abandoned calls on most ACD systems, allowing you to then use a revised formula to measure your call centre Call Abandon Rate.
By using a revised formula and analysing your results, you can do a number of helpful things, including:
- Assess the effectiveness of your on-hold messaging
- Evaluate if your staffing is correctly distributed
- Plot call abandon curves
What Is the Industry Standard Call Abandon Rate?
Generally speaking, a call abandonment rate of 2% is seen as good, with 5% being seen as an acceptable figure.
However, what is regarded as “good” will vary from one sector to another. If you are in a competitive retail environment, for example, 5% would not be an acceptable figure – as each abandon represents a potential missed customer.
Alternatively, if you work in technical support, you could allow a higher abandon rate because the customer will be more willing to wait, as you will have the answers that they so desperately require.
Anything above 5% would be seen as problematic.
For the industry standards of other contact centre metrics, read our article: What Are the Industry Standards for Call Centre Metrics?
Mistakes to Avoid When Calculating Call Abandons
While the call abandonment rate formula may seem straightforward enough, there are a few common mistakes that contact centres make when putting it into practice.
1. Failing to Account for Your IVR
It is essential that you measure the abandon rate from the telephone network side of the system, as well as the agent queue. Many people fail to measure calls being abandoned in the IVR.
The reason for this is that they have chosen to only start the statistics from the moment that people left the IVR and joined the queue properly.
One company even discovered that 18% of calls were being abandoned in the IVR system – something that had not shown up on the queue reports.
2. Double Counting Transferred Calls
Another mistake that people often make is to count transferred calls as calls that have been handled twice.
For example, if a call was answered in the sales queue and then transferred to the customer service queue, it would be easy to count this as two calls answered. This would then make the abandoned call rate lower than it actually is.
3. Failing to Take Action
When you notice that your abandon rate spikes at certain points in the call queue, question that.
For starters, consider whether these are “good abandons” where a helpful IVR message solved their problem or deflected the contact successfully onto another channel.
If this isn’t the case, you’ll likely have “bad abandons”, where the customers get irritated by the music or your sales messaging or maybe you will have reached their limit in how long they are willing to wait.
Consider all of this and adapt your on-hold / IVR strategy.
How to Create Call Abandon Curves
There are a number of useful things that you can do with the call abandon statistics, but one often underutilized technique is to create a call abandon curve.
With your call abandon data ordered in an Excel or Google Sheets document, plot each data-point on a graph with your percentage of callers still in queue on your Y-axis and time on your X-axis. This will sort your abandons by time, as in the chart below.
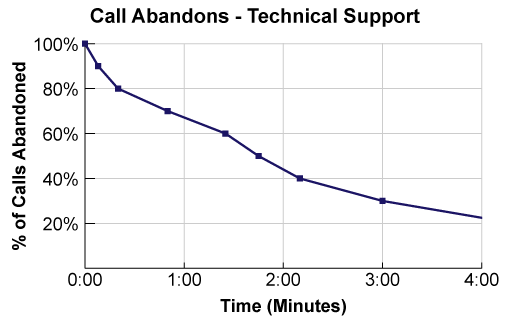
The bonus of creating a graph like is that it paints a picture of what is causing your callers to abandon, while it will also show you how many abandoned calls you can save by changing up your service level.
Yet that’s not all, as these graphs will also enable you to calculate a metric called “Average Patience”.
For a step-by-step guide on how to plot a call abandon graph, read our article: How to Bring Down Your Call Abandon Rates
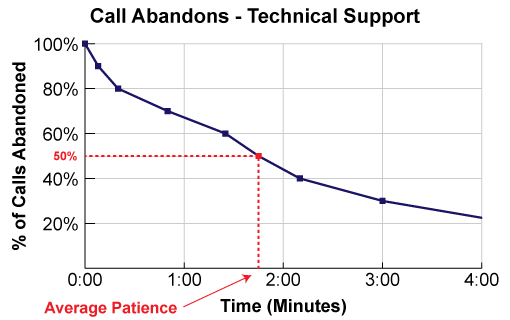
Adding Average Patience to the Call Abandon Curve
Average Patience, also known as Average Time to Abandon (ATA), is the average length of time that a caller will stay in a queue before they will abandon (or hang up the call).
You may be able to derive this statistic from your ACD reports. If not, you can take the call abandon curve from the point above and find the time in which 50% of your callers abandon. This is your figure for Average Patience.
We have highlighted this process in the example below:
Why is this number important? Well, it is a key input into good Erlang Calculators that are used in many contact centres in order to calculate the number of staff they need.
Therefore, if you know your value for average patience, you can more accurately use this tool to staff your contact centre.
To check out our Erlang Calculator, which factors in Average Patience, follow the link: Erlang Calculator – for Call Centre Staffing
How to Predict Call Abandon Rates
The Erlang A formula gives you the ability to predict the number of calls that will abandon based on the call volume, the number of staff that you have available and the average patience of your callers.
The A in Erlang A stands for “Abandons”, and it was designed by the Swedish Mathematician Conny Palm in 1946.
Here is an article about it: A Beginner’s Guide to the Erlang A Formula
The easiest way to compute it is by using the Erlang Calculator and looking at the Abandon Column in the results.
Over time, you may also be able to predict your Call Abandon Rate based on your service level too.
You do this in three stages:
- Assess your previous abandon rates when the contact centre was operating with a whole range of service levels.
- Create a scatter graph using these insights.
- Look for correlations and create a curve, which can be used to predict abandon rates based on varying service level rates in the future.
Although Dave, one of our readers suggests that: “You should not remove any of the abandoned calls in your forecasting. Those must be counted into the volume. You must obviously normalize anomalous data (unforeseen spike in call volume e.g. Storms or weather conditions, or a system wide failure of your services that cause a spike in call volume etc) that otherwise wouldn’t “normally” have come in.”
For more details of this three-step method, read our article: How to Predict Call Abandon Rates Based on Service Level
How People Manipulate Call Abandon Rates
Like with all metrics, there are a number of ways that the figures get manipulated so it appears that your abandon rates are in better shape than is actually the case.
The two most common fiddles are:
1. Call Screening Groups
This is where calls are answered by a real person in a front-line group and then transferred to the real queue.
The call was technically answered by a human, so will not show up in the ACD statistics – although the customer’s query is not yet being “handled”.
2. Changing the Time Threshold for Short Abandoned Calls
Like many metrics, by simply changing the target, you can kid yourself (and senior management) that you are doing better than you actually are.
One example we have found is where someone changed the call abandon threshold to 20 seconds.
“Our call centre looks at calls that are abandoned after 20 seconds. We feel that callers that cannot or do not hold for at least 20 seconds may have reached the wrong number or do not need service at that time. We like to keep our target at less than 1% of calls abandoned after 20 seconds,” said one contact centre manager.
The delusion seems to be working. “By setting your own threshold, you may find that you are doing much better than you had originally thought,” she added.
How to Avoid Abandoned Calls
There are a number of tactics that can be used to reduce Call Abandon Rate in your call centre. So, to finish off, let’s take a look at some of these ideas.
Put More Staff on the Phones at Key Times
Perhaps this may be rather obvious, but callers tend to abandon when you do not have enough staff available.
Improve Forecasting and Scheduling for Call Peaks
Call peaks can often be predicted from past patterns and can be helped with better scheduling.
Implement Call-Backs
One easy way to reduce call abandons is to offer people the chance to leave a call-back and then keep the call-back in the queue until it reaches an agent. This approach only works when you have sporadic peaks in call demand rather than being continuously understaffed.
Improve In-Queue Messages
People often abandon after they have heard a queue message, particularly if the message is on a loop.
By identifying the times where people abandon you may be able to change the wording of your messages (or slow down the frequency of on-hold messages) to reduce the number of abandons.
Review Your IVR
Assess your IVR navigation time, the number of options in your IVR and the number of layers within that. What could be causing people to drop out?
For more ways to lower your abandon rate, read our article: 18 Simple Ideas to Reduce Your Abandon Rate
Find out how to calculate more useful contact centre WFM metrics by reading these articles next:
- How to Calculate Contact Centre Service Level
- How to Calculate Occupancy
- How to Calculate Contact Centre Spin
Author: Jonty Pearce
Reviewed by: Robyn Coppell
Published On: 2nd Nov 2020 - Last modified: 7th Feb 2025
Read more about - Customer Service Strategy, Abandoned Calls, Call Handling, CX, How to Calculate