In our What Contact Centres Are Doing Right Now (2023 Edition) research – sponsored by NICE – we polled the industry on their current workforce management practices. Here’s what they said…
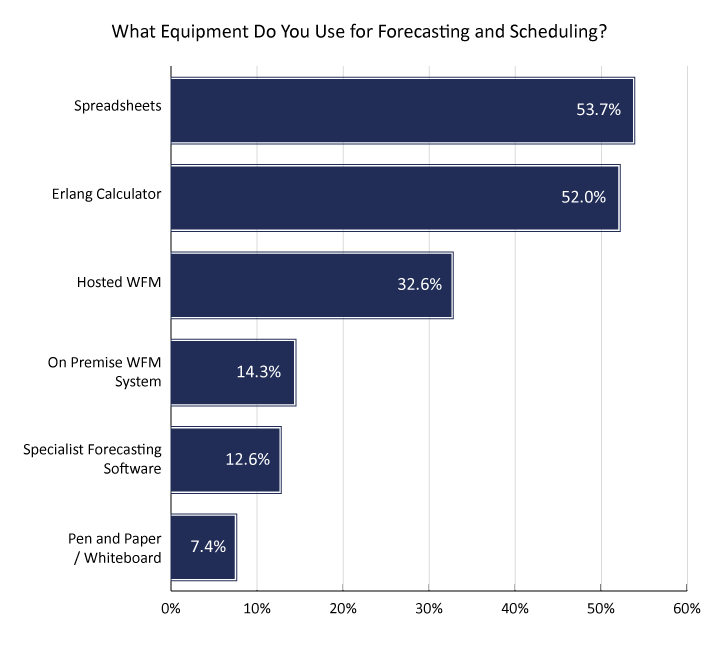
52% Used an Erlang Calculator for Forecasting and Scheduling
| Forecasting & Scheduling Equipment | Response % |
|---|---|
| Spreadsheets | 53.7% |
| Erlang Calculator | 52% |
| Hosted WFM | 32.6% |
| On premise WFM system | 14.3% |
| Specialist Forecasting Software | 12.6% |
| Pen and Paper / Whiteboard | 7.4% |
Hosted WFM Taking the Lead Over On-Premise Solutions
Contact centres are slowly embracing cloud technology as the norm – with only 14.3% using on-premise WFM solutions, compared to over double (32.6%) using hosted WFM solutions.
Majority Relying on Erlang Calculators and Spreadsheets
Despite this, the survey findings overwhelmingly showed that Erlang calculators (52%) and spreadsheets (53.7%) are still being heavily relied on by contact centre professionals for their forecasting and scheduling.
Less Than 1% Said They Were Offering Micro-Shifts
| Shift Pattern | Response % |
|---|---|
| Full-Time Shift | 90.5% |
| Part-Time Shift | 58.7% |
| Rotational Shifts | 31.8% |
| Split-Shifts | 21.2% |
| Banked Hours | 12.9% |
| Micro-Shifts (less than one hour) | 0.6% |
| Other | 4.5% |
Contact Centres Embracing Flexible Working Options
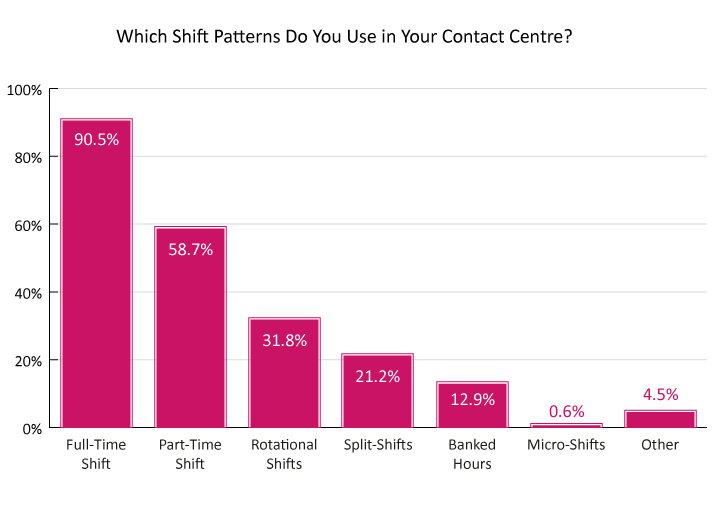
Beyond the continuing popularity of full-time shifts (at a steady 90% year-on-year), 58.7% of contact centres are now offering part-time shifts.
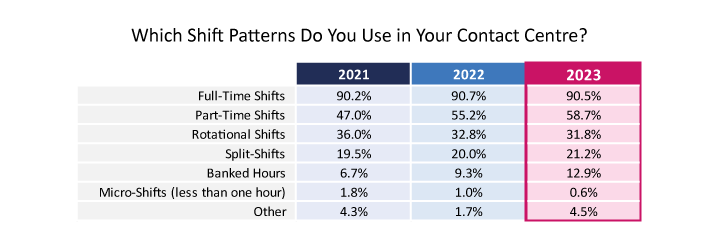
This trend has shown a consistent increase in recent years – up from 47% in 2021 and 55.2% in 2022.
Split-shifts are showing similar trends (gradually increasing from 19.5% in 2021 to 20% in 2022 and up to 21.2% in 2023), as are banked hours, which have also increased in availability over the years (from 6.7% in 2021 to 9.3% in 2022 and 12.9% in 2023).
This suggests that contact centres are responding to the needs of their frontline, embracing flexible working, and providing more variety for a better work–life balance.
For example, split-shifts better support working parents needing to do the school run in the middle of the afternoon – without compromising on a full-time salary.
Micro-Shifts on the Decline as World Opens Up Post-Covid
On the flip side, micro-shifts have shown a steady decline since 2021 – falling from 1.8% to 1% in 2022 and 0.6% in 2023. It’s unsurprising that this decline coincides with the end of Covid lockdown restrictions and the gradual return to the office.
This is because micro-shifts are typically defined as a quick burst of support of less than one hour, with the purpose of supporting peak or unexpected demand, and are wholly impractical for many frontline agents who’d now need to commute into the contact centre to complete their micro-shift.
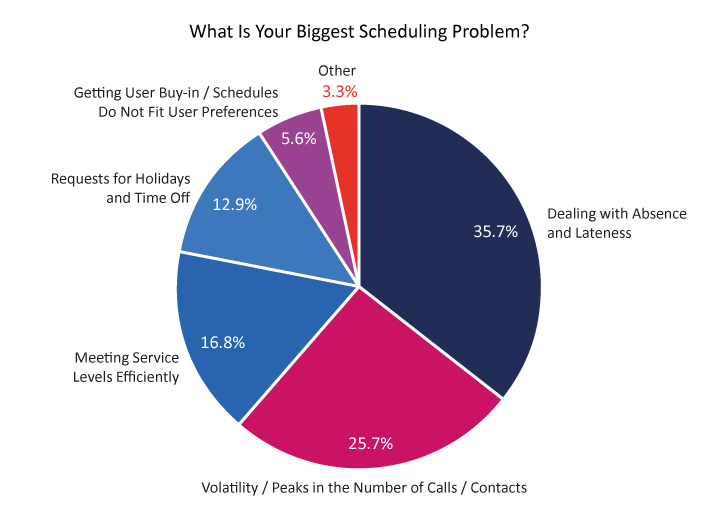
35% Rated Absence and Lateness as Biggest Scheduling Problem
| Biggest Scheduling Problem | Response % |
|---|---|
| Dealing with Absence and Lateness | 35.7% |
| Volatility / Peaks in the Number of Calls / Contacts | 25.7% |
| Meeting Service Levels Efficiently | 16.8% |
| Requests for Holidays and Time Off | 12.9% |
| Getting User Buy-in / Schedules do Not Fit User Preferences | 5.6% |
| Other | 3.3% |
Absence and Call Peaks Continue to Be Top Scheduling Headaches
Overall, the biggest scheduling problems contact centre professionals said they were facing were dealing with absence and lateness (35.7%) and volatility/peaks in the number of calls (25.7%).
These year-on-year trends highlight the stress of the unknowns, and contact centres being at the mercy of the engagement of their staff and the needs of their customers.
However, this also suggests that there’s ample opportunity for contact centre leaders to take a more proactive approach to addressing these challenges.
For example, creating scheduling playbooks to manage spikes in service demand, and revisiting employee engagement programmes to try and shift the dial on repeat offenders for lateness and absence.
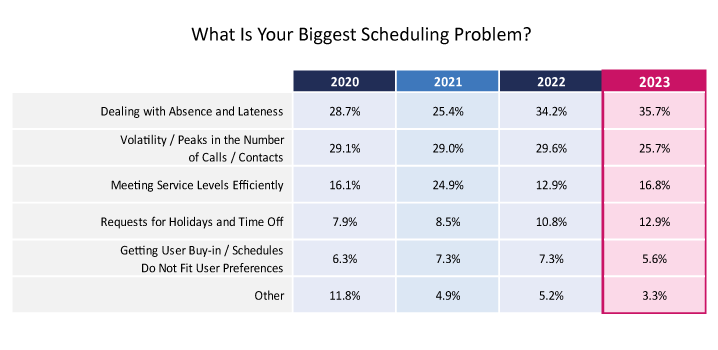
Holiday Requests Become Bigger Challenge as Travel Industry Recovers
It was unsurprising to see that requests for holidays and time off have become an increasingly bigger scheduling problem – cited by 7.9% in 2020, 8.5% in 2021, 10.8% in 2022, and up to 12.9% in 2023.
This is arguably in parallel with the travel industry recovering from the effects of the pandemic and therefore more employees competing for annual leave for trips abroad.
In addition, of the 3.3% who said ‘other’, survey respondents cited complex multiskilling, intermittent family and medical leave (FMLA), manual processes and inaccuracies, having no scheduling software, and staffing levels being too low as additional scheduling problems.
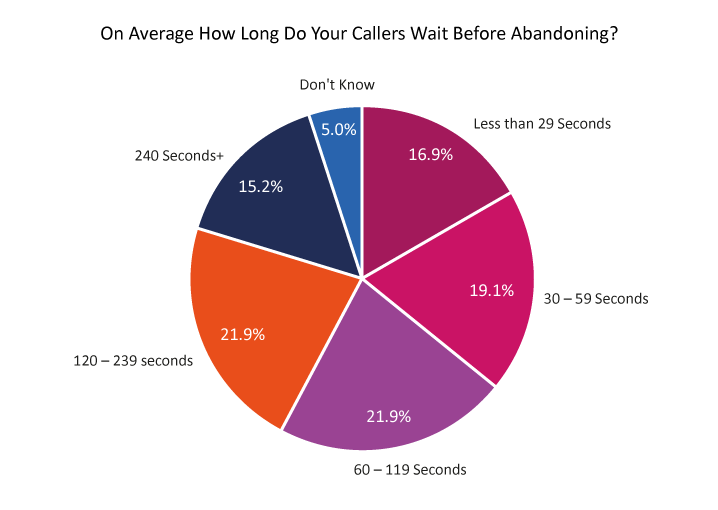
Only 15% Said Callers Would Wait 240+ Seconds Before Abandoning
| Call Abandon Time | Response % |
|---|---|
| Less than 29 Seconds | 16.9% |
| 30 – 59 Seconds | 19.1% |
| 60 – 119 Seconds | 21.9% |
| 120 – 239 seconds | 21.9% |
| 240 Seconds+ | 15.2% |
| Don’t Know | 5% |
A Third of Callers Too Impatient to Wait More Than 1 Minute
When asked ‘On average, how long do your callers wait before abandoning?’, 16.9% of survey respondents said less than 29 seconds, whilst a further 19.1% said 30–59 seconds – revealing that a third of the industry are under pressure to answer their calls in less than 1 minute.
However, we saw an even spread of results here, which may be reflective of the mix of industries represented in this survey – particularly as 15.2% of survey respondents said their callers wait for 240 seconds+ (4 minutes or more) before abandoning.
This suggests that some callers are far more patient than others, or perhaps have lower expectations of how quickly they expect their call to be answered.
Another possible theory here is that those contact centres with multiple channels are seeing their calls abandoned sooner as their callers attempt to get through on another channel faster.
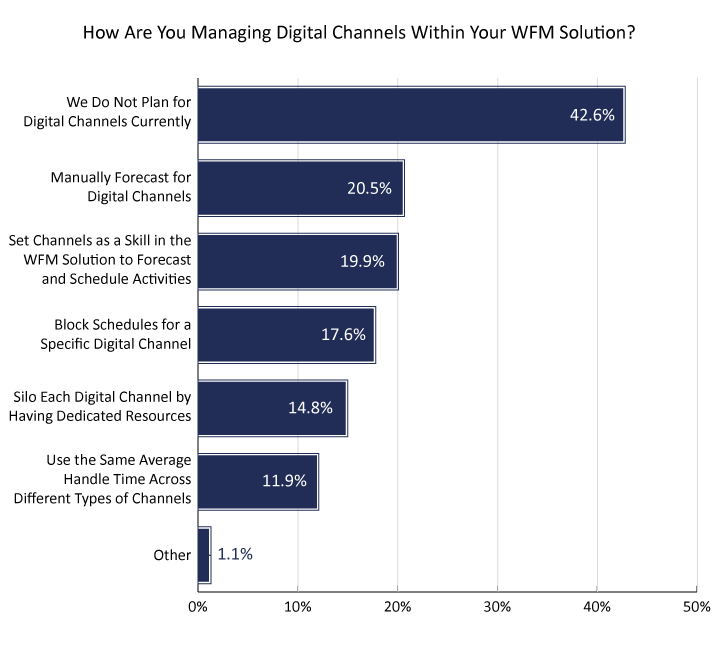
20% Said They Manually Forecast for Digital Channels
| Method of Managing Channels | Response % |
|---|---|
| We Do Not Plan for Digital Channels Currently | 42.6% |
| Manually Forecast for Digital Channels | 20.5% |
| Set Channels as a Skill in the WFM Solution to Forecast and Schedule Activities | 19.9% |
| Block Schedules for a Specific Digital Channel | 17.6% |
| Silo Each Digital Channel by Having Dedicated Resources | 14.8% |
| Use the Same Average Handle Time Across Different Types of Channels | 11.9% |
| Other | 1.1% |
Almost Half of Contact Centres Don’t Plan for Digital Channels in Their WFM Solutions
When asked ‘How are you managing digital channels within your WFM solution?’, a staggering 42.6% of survey respondents said they do not plan for digital channels currently in their WFM system.
This suggests that the learning journey for effectively managing these channels is very much in its infancy, and that many organizations struggle with this.
This is quite concerning, particularly as 20.5% said they manually forecast for digital channels, because traditional call-handling calculations aren’t fit for purpose for many digital interactions (such as live chat and email), as these are asynchronous conversations and harder to resource for.
Run in partnership with Sabio, Centrical, Odigo, Scorebuddy, and NICE, this survey focused on the key elements of a contact centre, including advisor experience and engagement, artificial intelligence (AI), customer experience, quality assurance, workforce management, and more!
Related Research
To download the full copies of our ‘What Contact Centres Are Doing Right Now’ survey reports, follow the links below:
- What Contact Centres Are Doing Right Now (2023 Edition)
- What Contact Centres Are Doing Right Now (2022 Edition)
For more great information, check out our other Contact Centre Research
Author: Robyn Coppell
Published On: 13th Jun 2024
Read more about - Contact Centre Research, benchmarking, NICE, Survey, Trends, Workforce Management (WFM)


