We present original research into the role of the planning team, assessing how the responsibilities of a WFM Manager changes from one contact centre to another.
Targets for Planners
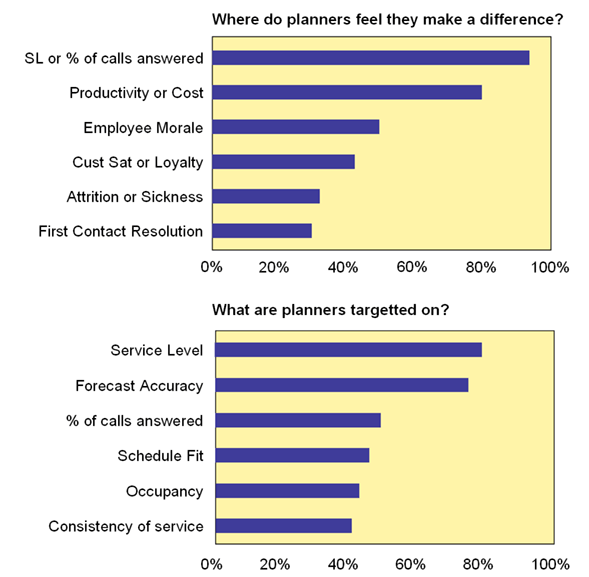
The research shows that targets for planners are changing significantly, with a clearer focus on their effectiveness at forecasting, scheduling and service consistency.
Service level and cost are still the areas where they feel able to make most impact, as some of the results below suggest.
- Only 30% feel they can influence first contact resolution, 40% customer satisfaction/loyalty, or 33% attrition/sickness (33%). The higher levels of team leader buy-in in Travel showed up in stronger scores for influencing sickness and attrition.
- 95% felt they had influenced service level/calls answered and 75% of planning teams are targeted on these metrics. This was common among most sectors and types of centre – reflecting the traditional focus of resource planning teams.
- 80% felt they had influenced productivity/cost – only the public sector had weaker scores in this area, perhaps reflecting less maturity in resource planning and weak buy-in from team leaders.
- There was also a very big move towards measuring the effectiveness of the contribution of planning. 72% are targeted on forecast accuracy and 44% on schedule fit, which were questions we asked for the first time. 39% are targeted on consistency of service – up from only 18.5% in 2009.

Find the latest service level targets, across all channels, in our article: What Are the Contact Centre Service Level Standards?
Ratios of Planners to Agents
The impact of a planning team is not only linked to the use and effectiveness of technology, but also to how the planners work within the business and their workload.
- The ratio of planners to agents is now 1:88. It was 1:100 in 2007. Larger centres benefit from a clear economy of scale. Operations over 1,000 agents have far more planning teams with over 100 agents to one planner.
- Centres under 500 agents are far more likely to have a ratio of 1:50 or less. Variation by sector mainly reflects the size of centre in each sector.
- The key driver seems to be business structure (e.g. the number of skills to forecast for, the need for extended real-time coverage) than by agent related tasks (e.g. administration of time off), because larger operations are more likely to have automated admin processes with self-service technology.
- Buy-in from Marketing is still the No.1 challenge for over 60% of planning teams, followed by IT and Finance. It is great to see that buy-in and support from senior managers and call centre managers is sufficient in over 80% of cases.
- Crucially, no in-roads are being made in the battle to win support from team leaders – still sitting at 64%. In fact only 10% regard team-leader buy-in as excellent, compared with 36% for other managers. There are marked variations between sector, with some clear evidence of good practice in outsourcing.
Planning Team Ratios by Sector
- Public Sector 1:57
- Retail & Leisure 1:58
- Finance 1:104
- Outsourcing 1:75
- Telecoms 1:87
- Overall 1:88
The overall average without financial services is only 1:77
Obstacles to Team Leader Buy-In and Understanding
- Team leaders get sucked into the day to day
- Damaged credibility of systems and process
- Lack of training and education
- Lack of accurate data to support planning
- Resourcing/budgeting driven by Finance (top down)
- Maintaining effective control against pace of change
- Getting operational managers to understand the impact of adherence and the importance of planning in meeting targets
Not Enough Team Leader Buy-In
- Local Government 73%
- Insurance/Other FS 50%
- Retail/Leisure 44%
- Utilities 30%
- Travel 25%
- Banking/Retail FS 22%
- Outsourcing 18%
Excellent Buy-In
- CC Managers 36%
- SMs/Directors 36%
- Team leaders 10%
- IT 7%
- Finance 11%
- Marketing 1%
Training and Development
- Over 56% of those in planning or MI related roles received no training or development in the past 12 months – a worrying figure given the technical aspects of the roles, even though this is down from 65% in 2007
- While 37% of teams reported that they had all received training, almost three-quarters were in small teams of 4 or fewer and in the larger teams (10+ planners) far fewer had received training
- Most benefit is being realised with 1-1 personal coaching and training, with 79% feeling this made a significant or extremely useful addition to their team’s ability. This may be partly due to the absence of formal professional training
- Training by hardware and software vendors scores poorly, with only 54% feeling they got meaningful results from the experience – perhaps where some courses feel ‘off the shelf’. In-house training scores worst at 34%, probably due to the specialist requirements of a uniquely technical team
Recruitment and Selection
- 75% identified lack of suitable candidates as the major problem when recruiting
- Surprisingly, 56% still expect to have to train and develop new hires, primarily due to what is felt to be a lack of suitable candidates – as in 2008 (58%)
- Less surprisingly, recruitment has slowed up with only 46% having recruited analysts in the past 12 months, down from 81% in 2008
Top Three Issues When Recruiting
- Lack of suitable candidates 75%
- Salary expectations 37%
- Career progression 23%
For some more excellent advice for improving workforce management, to go alongside this fascinating research, read our articles :
Author: Jonty Pearce
Published On: 14th Mar 2010 - Last modified: 13th Feb 2020
Read more about - Workforce Planning, Forecasting, Scheduling, Team Management, The Forum


