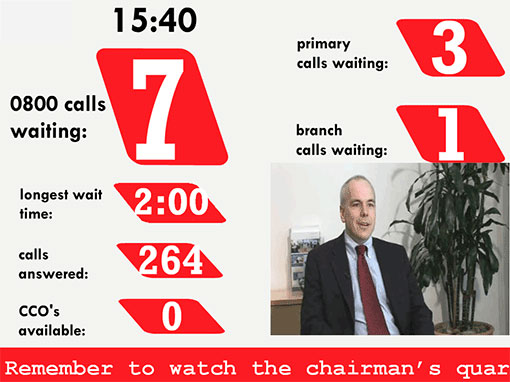
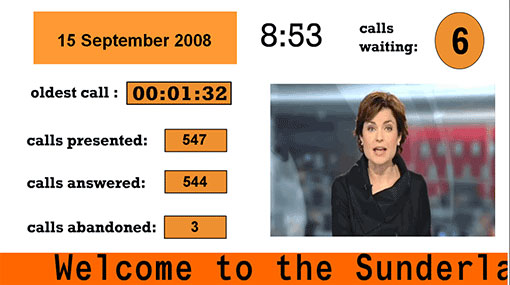
This week is another special issue. We look at the most visible of all items in the call centre – the Wallboard.
Wondering what to display on your LCD, plasma screens or wallboards? Ray Edun has given us some ideas to help you gain a better return on your investment.
1. Calls waiting
This statistic is probably the most widely used because it provides a simple overview of how busy the contact centre is. Ultimately managers can then use this information to identify that more agents are needed if a certain threshold is reached. Calls waiting can also be shown by campaign or by site, helping team leaders to manage their own team.
2. Ticker
A text ticker that moves across the screen is a great way to send instant messages to the whole site or to a team. One contact centre manager for a major beverage firm said, “the ticker is a godsend”. It is used for motivational and “feel good” messages such as birthday announcements, as well as calls to action.
3. Campaigns and campaign performance updates
This is useful for motivating agents as well as informative. For example, one contact centre originally distributed campaign information on A4 sheets at the beginning of the month with no reminders during campaigns. Now, the campaign information, including updates and changes are shown on a regular basis via LCD screens so that the agents are always fully informed.
4. Broadcasting special events on television
An increasing number of contact centres are broadcasting television, from news channels to special events such as Comic Relief or the Olympics. The most common rationale for this, especially during major sporting events, is to decrease absenteeism and increase morale. It can also increase the impact of the screen if more than pure business statistics are displayed.
5. Agents logged in/out
This is important data for managing the Calls Waiting queue. It tells managers which agents are logged in and able to take calls, or who has logged out. For example, if 20 agents are assigned to seats and only 10 are actively handling calls, the manager can then investigate why that is and take appropriate action.
6. Service level (internal, external)
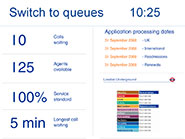
Many contact centres are required to provide Service Level Agreement (SLA) details to their customers. Similarly, some internal SLAs are shown for productivity or motivational purposes, for example ‘time to answer’, which states the average time it takes agents to connect to an inbound call.
Many contact centres implement Key Performance Indicators (KPIs) which dictate a time limit in which a queuing call should be answered, for example within 60 seconds. This shows how they are measuring up in terms of the SLA.
7. Abandoned rate
This is the number of callers who hang up while waiting. If people are waiting too long and the abandoned rate is too high, action can be taken, for example instructing additional agents to log in.
8. Calls answered
This indicates the number of calls answered within a given time period, for example, a week, month or even annually. Showing this cumulative figure daily will indicate how the contact centre is doing in reaching targets and whether any strategic changes need to be made to achieve them. It is also useful during periods where the contact centre is busier than usual, for example if a particular marketing campaign or special offer has been launched.
9. Longest call waiting
One contact centre operating a legacy system used this statistic to let them know when to reset the system. Some calls would get stuck in the queue and the only way they would know this was by longest call waiting.
10. Agents active/agents idle
In a similar way to displaying how many agents are logged in or out, this can assist the manager in determining how agents can be re-distributed to busier campaigns.

Ray Edun is the Sales Manager at Plasmanet
[Are these metrics the ones that you use in your call centre? Do you display something different on your wallboards, or do you even use wallboards these days? – Please add your thoughts in an email to Call Centre Helper – Editor]
Author: Jo Robinson
Published On: 24th Sep 2008 - Last modified: 13th Oct 2017
Read more about - Technology, Service Level, Top 10, Wallboards




This is a super way of having the key details in a crisp and collated form. Kindda, gets the agent to be v.alert and make a positive difference to their performance
Eh, I’m not so sure about most of those.
Unless the agents have a good feel for the queue, things like number of calls waiting aren’t helpful. In fact, I’ve found that they tend to discourage agents (Who cares if I finish this call? There are 45 waiting), and drive behaviors like “Hey, watch – see the 5 calls in queue?” *hang up hang up hang up hang up hang up* “Now it’s empty!”
Agents logged in also tends to send them in to the “Why is no one else working? Why is every one a slacker?”
The wallboard is only ever a resource for the operators who are performing correctly to utilise. Its not a manager…
I assume that’s your job Derek…
I find the longest wait is a good measure as this is an indicator of customer experience and more meaningful to agents than the number in a queue.
On the subject of wallboards in general, I think there is a gap in the market for the wallboards to be a bit more visually inspiring and graphical. It seems as though LED displays and boxes with numbers is all that is available. Surely there could be a more creative solution?
Where do I get a wallboard like the samples in this article? Is there a company that develops them? Is there a package that is flexible enough to let me build one?
Post removed – no advertising please!
I am also urgently looking for a wallboard that would work with our Avaya system. Could someone advise where to source these please?