Our readers share their thoughts on how they are tackling the latest forecasting challenges in their contact centre.
How Many Years’ Worth of Data do You Use to Inform Your Forecasts?
Most forecast planners use a minimum of 2 years’ worth of data, but some are forced to use far less due to the nature of their business.
- We use 1 year’s worth of data to create our forecasts – Michael
- Usually five years. For seasonality I would like to use more, since 5 years of seasonality really only equates to 5 Januaries, 5 Februaries, etc. More of each month would be better – John
- In theory we should be using two years. However, this isn’t always possible, especially for new products when forecasting is still required in this space – Conor
- A minimum of 2 years, preferably more where the data is available – Peter
- We look at 2 years’ worth as standard to look at seasonal patterns – Corinne
- As an outsourcer, we use a much shorter history (4-8 weeks) and adjust for seasonality – Kelly
- We look at 2 years’ worth of data, but generally use data within the last year to get the monthly trends as they are more recent – Mark
- Having major changes every 12-18 months, it is impossible to use data older than 6 months, unfortunately – Ralph
How Accurate Are Your Forecasts?
There is considerable variance in the level of accuracy being achieved across the industry, with between 5% and 20% being the norm.
- Not as accurate as we’d like to see. We can get up to 75%-80% for some clients, perhaps only 50% for some others – Kelly
- Ranges from around 20%-21% out, depending on the line and the month – Jessie
- We have different forecasts for different markets. Accuracy depends greatly on volume count. Large markets perform better and small markets are very difficult, but the aim is to be within 15% error at daily volume level – Conor
- We aim for a weekly MAPE (Mean Average Percentage Error) of 5%. In reality, we achieve closer to 10%. Our service queues are more accurate than sales – Mike
- Monthly this year +/-6% – Ralph
- Around +/- 5% for the whole centre; however, some of our queues can be up to +/- 20% difference – Julia
- Our forecast is within 10% variance to actual calls – Mark
Find out how to measure the accuracy of your forecasts in our article: How to Calculate Forecast Accuracy
What Have You Tried to Increase Forecast Accuracy?
Some forecast planners have tried tidying up their data and communicating more with other departments to help increase their forecast accuracy.
- Getting better inputs from marketing about campaigns and working closely with finance to have best possible distribution of bills, reminders, etc. – Ralph
- Tidying up historical data and excluding days with non-typical call volumes – Raniero
- We ensure “out-of-the-ordinary” days are excluded from future forecasting – Mark
- We have combined data sets where data is sparse (more data = better-fitting model) and tweaked various assumptions. But as long as we can “predict the past”, we are reasonably confident in the model going forward – John
- We generally look at 3 ‘typical’ weeks and take an average distribution – Mike
- We always deal with bank holidays separately – Vatsana
- We now use a tool that has the capability to mark a day as a “special day”. This will then be automatically excluded for the coming forecasts – Ralph
- We exclude our anomalies (usually holidays) when planning for regular days. We then forecast and schedule our anomaly days separately – Kelly
- Where there are any irregularities in the data, we speak to the team and department and get insight into what happened. We then learn from this and adjust accordingly for one-off events, new trends or recurring events – Peter
- We use regression analysis to split out anything we want or don’t want in our models – Matt
- I have a baseline forecast which should account for the standard day, and then apply an uplift for upcoming campaigns and events – Raniero
Find more tips like this in our article: 25 Ways to Improve Your Contact Centre Forecasting
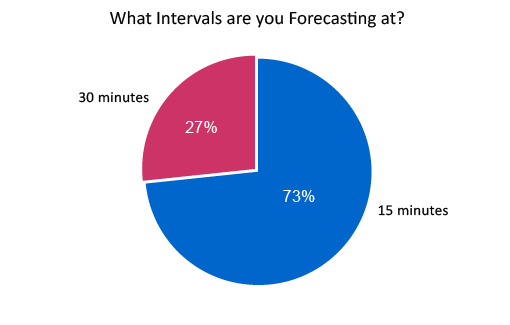
What Intervals Are You Forecasting at?
Most forecast planners interval at either 15 or 30 minutes.

What Is the Biggest Mistake You Have Ever Made With Your Forecasting?
Our readers confess to “normalising data” too much and not building in any resilience.
- We once tried to provide forecasting for a market that was too small and had data that was too segmented – Conor
- Blindly trusting a client’s forecast – Kelly
- “Normalising” the data too much. We have learnt not to strip out too much from the data – John
- Missing a zero from a monthly total! This meant we supplied significantly less resource than demand required – Michael
- Not being able to build in any resilience to the forecast – assuming the advisors are going to be in the right place at the right time sometimes causes us headaches – Mark
- We once shocked one of our clients with a terrible service level forecast. The reason being that we used a completely different formula to calculate service level than our client was used to – Ralph
How do You Generate Your Forecasts? Manually or Using WFM Software?
There is a strong trend for a “best of both worlds” approach when generating forecasts, combining the results from WFM software and spreadsheets.
- Excel for back-office forecasts and WFM for front office – Lucy
- WFM, and checking against a manual forecast as well to validate – Jessie
- We generate our forecast manually – Amarjaragl
- We look up forecasting methods and program them into Excel, as we find it easier to explain results that we can program ourselves into Excel – John
- Spreadsheet at the minute; however, we’re getting WFM soon – Mark
- Here we have a WFM tool – Sophie
- We start with a spreadsheet, then put the figures into WFM for finer forecast amendment – Julia
- Manually for the monthly volumes (considering marketing activities, etc.) and using our WFM tool for the interval distribution – Ralph
- We generate using WFM, then adjust manually using spreadsheets – Corinne
- We use WFM alongside an Excel sheet – Matt
- We use WFM software and then tweak the results manually – Raniero
Find out about the most up-to-date forecasting models in our article: The Latest Techniques for Call Centre Forecasting
Do You Find It Difficult for People to Buy-In to Your Forecasts?
Issues with buy-in vary from contact centre to contact centre, but simplifying the data output and establishing a solid reputation can help ease the pressure.
- Yes, we are fighting myths about the centre on a regular basis – Peter
- Generally, there is no problem with upper management buying in to the call forecast. The corresponding staffing needs are sometimes a different story – Kelly
- Yes and we are put under pressure to deliver lots of other activities like training, meetings, 1-1s, etc – Mark
- No. We have lots of graphical output and models that are easy for management to understand – John
- If the assumptions are clearly documented it makes it easier. However, we do have some issues with marketing buy-in at times, as they have a tendency to want to own forecasts – Michael
- I think if your forecasts have been accurate in the past, it makes it an easier sell. It’s newer product forecasts that we sometimes have issues with – Michael
- We document all adjustments with justification, so we have a point of reference if people are reluctant to buy into it – Corinne
How do You Forecast Email, Live Chat and Social Media?
Some planners forecast their digital channels through testing and making good use of any historical data available.
- We have our emails delivered through the telephony software, so we forecast in the same way as inbound calls – Julia
- We make good use of any historical data we have – Barry
- We have been using these newer channels for a couple of years, so we have historical data to forecast from – Julia
- Usually we use historical data to predict the impact of new campaigns, or we do a test with a small number of customers to check impact – Ralph
Click here to download our Monthly Forecasting Excel Spreadsheet Template
For more on the topic of contact centre forecasting, read our articles:
- A Guide to Workforce Forecasting in the Contact Centre
- 25 Ways to Improve Your Contact Centre Forecasting
- How to Forecast With Minimal Data
Author: Megan Jones
Published On: 13th Jan 2016 - Last modified: 12th Feb 2020
Read more about - Technology, Excel, Forecasting, Workforce Management (WFM)


