Our reader panel share their top tips for forecasting in Excel.
1. The [H]:MM:SS time format allows you to count above 24 hours
When I work with time, I always use [H]:MM:SS.
This allows you to count time above 24 hours.
With thanks to Neil
2. Use ribbon short cuts to access pivot tables
I use ribbon short cuts to access pivot tables and other frequently used tasks.
This is a more efficient use of my time.
With thanks to Conor
3. Show forecasts in graphical format for everyone to easily understand
I always find it is useful to show forecasts in a graphical format.
Not everyone can look at a table and understand it easily.
With thanks to Laura
4. Use calculated fields in pivot tables to save adding extra columns to your data
I use calculated fields in pivot tables to save adding extra columns to my data.
With thanks to Michael
5. Select whole columns – not just the cells
I select the whole columns where my data is in the source file – not only the cells.
With thanks to Ralph
6. Use the WEEKNUM function in Excel to incorporate your previous years’ data
I use the WEEKNUM function in Excel to incorporate my previous years’ data with the recent data to determine WOM (Week of Month) and DOW (Day of Week) distribution.
With thanks to Michael
7. Create a holiday factors tab to determine need for uplift or reduction

Create a holiday factors tab that correlates volumes on particular dates vs normal seasonal volumes – and recognises this for the next date in the series.
You can then give uplift or reduction based on the previous volumes of that set only.
With thanks to Nick
8. Public holidays workday formula in Excel
Here is a workday formula in Excel that I use for public holidays –
=WORKDAY(Date,NumberOfDays,PublicHolidayList)
With thanks to Mat
9. Use Non-Business-As-Usual activity instead of a standard % shrinkage
We have moved away from applying a standard % shrinkage and instead have been tracking non-BAU (Business as Usual) activity.
We then apply a variable shrinkage forecast based on planned activity and known holiday bookings for the coming months.
With thanks to Fiona
10. Exponential smoothing and weighted average combined for long-term forecasting
I use exponential smoothing and weighted average combined for long-term forecasting, as exponential smoothing is not really good for long term.
With thanks to Francis
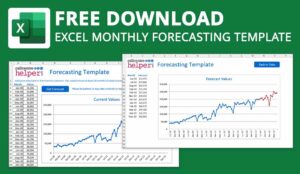
[Editor’s note – Our Monthly Forecasting Excel Spreadsheet Template can help here.]
11. Check the weather forecast to plan for sunny and rainy days
I always check the 7-day weather forecast 1 week in advance when doing my calls forecast.
I find that the sun and rain have a huge impact on customers’ behaviour. For example, if it is sunny they will be in the garden or out walking and there will be fewer incoming calls.
With thanks to Philippe
Additional Resources:
- Watch our free recorded webinar Excel Masterclass – Designing a Better Forecasting Spreadsheet
- Find out more in our FAQs – Forecasting With Spreadsheets article
- Try out our Free Excel Erlang Calculator
- Go back to basics with our An Introduction to… Erlang Calculations guide
- Click here to use our Online Call Centre Erlang Staffing Calculator – including Shrinkage
Author: Megan Jones
Published On: 6th Jul 2016 - Last modified: 19th Sep 2019
Read more about - Workforce Planning, Excel, Forecasting, Shrinkage


