


Occupancy is a critical metric in contact centres and BPOs, directly impacting both agent productivity and customer satisfaction.
Understanding how to measure and calculate occupancy is essential for optimizing staffing levels and ensuring efficient operations.
In this article, we’ll break down the occupancy formula, provide worked examples, and highlight key considerations to help you accurately track and manage occupancy in your contact centre.
What Is Occupancy and Why Is It Important?
Occupancy is a key performance metric used to measure how effectively contact centre advisors are utilizing their time. It is the percentage of time advisors spend on call-related activities, such as talk time, hold time, and after-call work (ACW), compared to their total logged-in time.
For example, if a contact centre has an occupancy of 75%, this means advisors are engaged in call-related tasks for three-quarters of their working hours.
While often referred to as “utilisation,” occupancy differs in that it only accounts for time spent on the contact centre floor, whereas utilisation includes time spent on other activities like training or meetings. Understanding occupancy helps optimize staffing levels and enhance operational efficiency.
The Occupancy Formula
The formula used to calculate call centre occupancy is:
Occupancy = (Traffic Intensity (Erlangs) ÷ Raw Agents) × 100
The Agent Occupancy Formula
To calculate call centre occupancy, first get a total of the amount of time each of its advisors spends on “call-related activity” – from the time that they sign in, to the time that they sign out – on a day-to-day basis. This is called the “total handling time”.
The contact centre would also need to tally the “total logged-in time” across the day. This is the total amount of time all advisors have spent “signed in” over the course of the day.
Once the contact centre has calculated these figures, it can then simply divide the number calculated for “total handling time” by the figure calculated for “total logged time” and multiply the result by 100, to find a percentage occupancy.
The agent occupancy formula is as follows:
Agent Occupancy Rate (%) = Total handling time ÷ Total logged time × 100
Below is an example of how to use this formula, using data from a team of seven contact centre advisors.
| Advisor | Signed In | Signed Out | Total Logged in Time(mins) | Total Talk Time(mins) | Total Hold Time(mins) | Total ACW Time(mins) | Total Handling Time(mins) |
|---|---|---|---|---|---|---|---|
| Advisor 1 | 08:54 | 14:02 | 308 | 195 | 21 | 58 | 274 |
| Advisor 2 | 08:56 | 13:58 | 302 | 182 | 14 | 62 | 258 |
| Advisor 3 | 08:56 | 17:30 | 514 | 323 | 37 | 92 | 452 |
| Advisor 4 | 08:57 | 17:32 | 515 | 304 | 30 | 101 | 435 |
| Advisor 5 | 08:59 | 17:26 | 507 | 311 | 34 | 94 | 439 |
| Advisor 6 | 13:25 | 17:39 | 254 | 165 | 11 | 49 | 225 |
| Advisor 7 | 13:29 | 17:31 | 242 | 151 | 13 | 52 | 216 |
| Cumulative | 2,642 | 2,296 |
(All the data included in this table can be found in the contact centre’s ACD system)
Using the data highlighted above, the contact centre would able to work out that:
- Total handling time = 2,296 minutes
- Total logged time = 2,642 minutes

With this information, the contact centre would be able to calculate that its rate is 86.9.
5 Key Considerations When Using Occupancy
1. Maximum Occupancy Should Not Exceed 85–90%
Maximum occupancy is often a factor that is ignored in the process of calculating how many agents you need in the contact centre. This doesn’t make any difference in a small contact centre, but it is a major factor in why so many larger contact centres are understaffed.
The simplest interpretation of occupancy suggests that the rate should be kept as high as possible, meaning that advisors use all the time available to them.
While it is broadly true that contact centres with high occupancy rates are running more efficiently, such a simple understanding of this data falls short of representing the realities of call centre planning.
In the video below, Call Centre Helper’s Jonty Pearce explains how maximum occupancy is the most common resource planning mistake that contact centres make when working out how many staff they need.
The most obvious consequence of occupancy rates that go above 90% is advisor burnout, as high occupancy means little or no time between calls. This is known to drive down both advisor satisfaction and performance, which may ultimately result in advisors leaving the call centre.
To understand if you need to take occupancy into account, you first need to set an occupancy target, just as you would for service level.
Instead of the earlier stated 100% figure, James Barnes, Director of Customer Contact Consulting, believes that most contact centres have a more realistic occupancy rate.
James says that “on average, my clients’ maximum occupancy ranges from 85% (in-house) to 90% (more performance driven).”
For more on why you need to keep an eye on your contact centre’s occupancy rates, read our article: Why Should Your Occupancy Rate NOT Exceed 85%?
2. Maximum Occupancy Should Not Be Set Higher Than 85% or 90%
James’s clients would have set an occupancy rate target of 85-90%, to find the ideal mix of productivity and achievability. A higher than 90% occupancy rate would likely lead to agents picking up undesirable behaviours on calls or succumbing to burnout or the contact centre having increasing attrition rates.
The Industry Average for Maximum Occupancy Is 83%
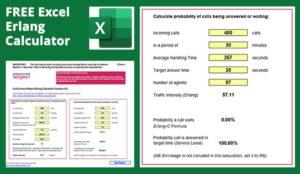
The average percentage entered into our online Erlang Calculator is 83.3%, based on over 160,000 calculations by contact centre professionals.
By having to enter an occupancy figure into the Erlang Calculator (a tool that contact centres use to determine the number of advisors needed), it becomes clear that it is important to measure for staffing calculations.
3. Calculating Occupancy Is Very Important in Large Contact Centres
The bigger that the contact centre grows, the more important it becomes to monitor occupancy, to ensure that it does not exceed 90%.
Why? Because when contact volumes increase, the number of contacts that each individual advisor handles will grow also. This results in an increasing occupancy rate.
The table below highlights this, which uses the following figures in its calculations:
- Average Handling Time (AHT) = 360 seconds
- Required Service Level (SLA) = 80%
- Target Answer Time = 20 seconds
- Shrinkage = 30%
| No. of Calls Per 30 Minutes | No. of Staff Need to Meet SLA | Average No. of Calls Per Advisor | SLA | Occupancy Rate |
|---|---|---|---|---|
| 1 | 1 | 1 | 100% | 20% |
| 5 | 5 | 1 | 91.9% | 33.3% |
| 10 | 6 | 1.7 | 84.4% | 50% |
| 50 | 20 | 2.5 | 86.1% | 71.4% |
| 100 | 36 | 2.8 | 84.2% | 80% |
| 500 | 156 | 3.2 | 83% | 91.7% |
| 1,000 | 302 | 3.3 | 81.8% | 94.8% |
| 5,000 | 1,453 | 3.4 | 81.3% | 98.3% |
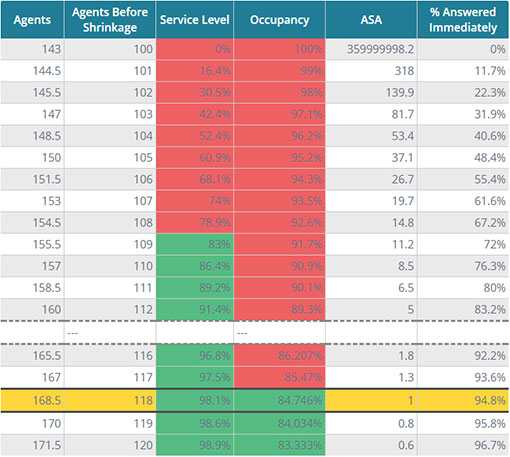
The table above shows that at 500 calls, the occupancy rate reaches 91.7%. So, when large contact centres make staffing calculations, it is very important to monitor occupancy to protect advisors from burnout.
For example, while a contact centre may need only 156 advisors to meet call volumes of 500 per half an hour and a service level of 80%, more advisors are needed to keep occupancy below 90%.
So, as shown below, our Erlang Calculator recommends that 160 advisors are needed instead.
4. Occupancy Requires Maintenance
When occupancy is too low, advisors have little to do, and the contact centre is essentially wasting money. When it is too high, advisors are overburdened, and the centre is operating too close to its capacity. Call queues will grow, and service level suffers.
The most direct way to influence occupancy is by changing the number of advisors taking calls. How effective this will be depends on the number of seats at the contact centre.
Smaller centres are more affected by changes in traffic volumes, but can respond more easily, as fewer advisors represent a higher proportion of the total workforce.
Blended advisors, advisors who can take inbound or outbound calls as required, make it reasonably straightforward to adapt.
Rather than being sent away, advisors can be assigned to other activities like email correspondence or e-learning. However, while this does fill time, the inability to measure progress means it is not guaranteed to be any more efficient than having advisors simply wait to take calls.
5. Occupancy Is Often Confused With Other Metrics
While occupancy certainly isn’t the most tricky metric to use, it is often confused with other contact centre measurements such as conformance, utilisation and adherence.
So, as occupancy is the percentage of time advisors spend doing call-related activities in relation to their total time available, the others differ like so:
Conformance – The total amount of time an advisor was scheduled to work versus the amount of time they actually worked, expressed as a percentage.
So, if an advisor was scheduled to work a shift of 180 minutes but instead works 184 minutes:
Conformance = (184/180) x 100 = 102.2%
Adherence – The amount of time advisors spend at work as a proportion of the time that they are scheduled to work, expressed as a percentage.
So, if an advisor shows up five minutes late to a 180-minute shift but works through to the end of their shift, their adherence will look like so:
Adherence = (175/180) x 100 = 97.2%
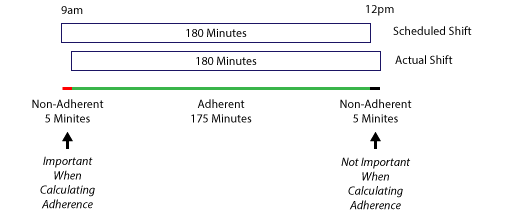
Conversely, if an advisor were to show up for a 180-minute shift work on time but leave five minutes early, their adherence rate would also be 97.2%.
For more information on occupancy in the contact centre, read these articles next:
- Top Tips to Optimize Occupancy and Utilization
- Difference Between Occupancy and Utilization
- Maximum Occupancy – The Most Common Resource Planning Mistake
Author: Jonty Pearce
Reviewed by: Jo Robinson
Published On: 14th Feb 2018 - Last modified: 21st Feb 2025
Read more about - Workforce Planning, Editor's Picks, Erlang Calculations, How to Calculate, Metrics, Occupancy