We look at how to measure and calculate absenteeism in the contact centre and in BPO.
What Is Absenteeism?
Absenteeism is the percentage of unauthorised time that members of the contact centre team are absent from the floor. It is also known as “absence rate”.
Included under the umbrella term of absenteeism are things like:
- Authorised and unauthorised sick leave (physical and mental health)
- Lateness due to a variety of reasons (e.g. transport issues, home emergencies)
- Unexplained leave / Suspect absences
- Appointments (doctor, dentist, lawyer, etc.)
- Family / Childcare emergency
However, do remember that things like paid holiday and jury duty shouldn’t be considered as absenteeism.
The Absenteeism Formula
Typically, absenteeism is calculated on a yearly basis in contact centres and BPOs, using the formula below:
Absenteeism (%) = (Number of Hours Taken Off for Unauthorised Absence ÷ Total Hours Scheduled by the Workforce Over the Period) × 100

However, there are a number of variations to this formula, to calculate different types of absenteeism, the cost of absenteeism and more, as we explore below.
Split Absence Into Short- and Long-Term Absenteeism
The trouble with measuring general absenteeism using the formula above is that it doesn’t provide you with a great deal of insight, other than a percentage figure.
Not only does it lack insight, but the percentage figure can be misleading. This is because, while the absenteeism percentage may seem stable, the number of long-term absences could be decreasing and the number of absent employees may be on the rise.
So, Martin Jukes, the Managing Director at Mpathy Plus, recommends splitting absenteeism into short-term and long-term absenteeism.
According to Martin: “Generally, short-term absenteeism is when an advisor takes up to five consecutive days off from work. Anything more would be considered long-term absenteeism. However, this could vary, depending on your organisation’s policy.”
Generally, short-term absenteeism is when an advisor takes up to five consecutive days off from work. Anything more would be considered long-term absenteeism.
Martin Jukes
With this in mind, include all the hours that advisors were absent for a spell of time that was fewer than five consecutive shifts in one equation. Then, include all the hours that advisors were absent for a spell of time that was more than five consecutive shifts in another.
By having two separate percentages, you can then separately assess any long-term absences and whether short-term absences are becoming an increasing or decreasing issue. This helps to remove the ambiguity from the overall percentage and gives you more insight into the underlying causes of your contact centre’s absenteeism.
Measure It on a Monthly Basis, not Annually
To gain even more insight into absenteeism, it is helpful to calculate a percentage every month, as opposed to annually. So, you would use the following formula:
Monthly Absenteeism (%) = (Number of Hours Taken Off for Unauthorised Absence This Month ÷ Total Hours Scheduled by the Workforce This Month) × 100

Martin Jukes is an advocate of measuring absenteeism monthly, due to the impact that absence has on Workforce Management (WFM) and therefore performance.
“Absenteeism impacts performance. If you have got a core demand coming in, you need a certain amount of resource to meet that demand. If you haven’t got that resource, your performance is going to suffer.”
Service levels will fall below your target with high absenteeism, meaning that customers wait longer, while if real-time service levels are presented to advisors on wallboards, they may begin to rush through contacts to relieve the strain on the contact centre, which will impact quality.
However, if you can track absenteeism on a monthly basis, you will notice that it spikes during certain months and around major events. Knowledge of the percentage absenteeism that you can expect from month to month will help you to improve the accuracy of future staffing calculations.
By accounting for absenteeism in staffing calculations, you can build flexibility into your schedules, which helps to reduce the focus on intraday management and the risk of understaffing.
Split Absenteeism Into Groups
Many assume that absenteeism is spread evenly across the whole contact centre. Yet there may be teams where absenteeism is much higher than in others.
Therefore, it can be useful to measure a percentage figure of absenteeism for each department in the contact centre. This will help to highlight where your problem areas are.
As Martin Jukes says: “If your contact centre has a very low absenteeism rate of one or two percent, you may think that it’s not necessary to measure absence rates for separate teams. However, what you may find is that it’s one team that is causing almost all of that two percent total.”
If your contact centre has a very low absenteeism rate of one or two percent, you may think that it’s not necessary to measure absence rates for separate teams. However, what you may find is that it’s one team that is causing almost all of that two percent total.
Martin Jukes
It is with this team where the focus really should be on reducing absenteeism. But remember, if you choose to incentivise attendance, do so for the whole contact centre. This will help to maintain a fair culture.
Run Trend Analysis
Having a percentage absenteeism for short-term and long-term absenteeism, as well as absence rates across each contact centre department, enables you to analyse trends.
These percentages should be combined with reasons for absence to give greater insight into trends in absenteeism.
I’ve known organisations where people thought they were entitled to have a certain amount of absenteeism. Trend analysis will help to unearth these myths.
Martin Jukes
To do this, Martin Jukes recommends: “Look for patterns. Consider if the number of people taking short leaves of absence is increasing. What about those taking long-term absence? Were members of the same team off for the same reasons? There’s a lot to think about.”
“I’ve known organisations where people thought they were entitled to have a certain amount of absenteeism. Trend analysis will help to unearth these myths.”
Trend analysis will also help you prepare for future absenteeism, while it should also provide insight as to what you can do to reduce absenteeism.
Calculate Absenteeism as a Cost
As well as calculating absenteeism as a percentage, many organisations find it useful to calculate the metric as a cost. This helps to bring value of attendance to light not only for you but also for the wider business and the advisors themselves.
Many contact centres and BPOs would use the following formula to calculate the cost of absenteeism:
The Cost of Absenteeism = (Number of Hours Taken Off for Unauthorised Absence ÷ The Hourly Rate of the Average Advisor’s Salary) × 100

However, the cost will likely be much greater than this because this only works out the cost of resource time, but there are also “opportunity costs” that need to be considered.
As an example of these opportunity costs, Martin Jukes says: “If you’re in a sales team and 10 percent of your team are absent, potentially that’s 10 percent of your business that you are going to lose.”
“There’s also time lost because of the administration side of absence and the return to work processes. There are a number of other ‘hidden costs’ that should be added to the cost of resource time.”
Yet there are still a number of benefits to simply working out the cost of resource time, as showing advisors a yearly figure of how much absenteeism costs the business can really bring the value of good attendance to life.
The cost always gains more attention than the percentage. A financial value is more striking than a percentage, and managing cost is something that every business is interested in.
Martin Jukes
Also, it’s better to show senior management the costs of absenteeism as opposed to a percentage. This is according to Martin, who says that: “The cost always gains more attention than the percentage. A financial value is more striking than a percentage, and managing cost is something that every business is interested in.”
If you highlight this cost when putting together a business case to reduce absenteeism, and highlight how your plan can cut these costs, you may be afforded more resources to help improve culture.
The Bradford Factor
Rather than measuring across the entire contact centre, the Bradford Factor offers an innovative way of measuring absenteeism on an individual basis.
Each advisor has a score that can be calculated using the following equation:

By attributing a score to each advisor, many contact centres use the score as a “trigger guide” as to when is best to start monitoring individual advisors and, from thereafter, start disciplinary processes.
What is an Acceptable Bradford Score?
Typically and acceptable Bradford Score is under 45.
There are three scores that, once reached or surpassed, require action. These are >45, >100 and >900. An example policy of what to do when these scores have been met is provided in the following:
>45: Show Your Concern – At this point, the manager sits down with the advisor to have a general conversation about their absence. The manager should warn the advisor of disciplinary actions if they should be absent again over the next month or so.
>100: Consider Disciplinary – This score is sufficient enough for the manager to start the aforementioned disciplinary actions. These actions may include formal monitoring, written warning and/or financial actions.
>900: Consider Dismissal – Once an advisor reaches a score of 900, there is grounds for dismissal. If the manager/team leader has any objection, a final written warning should be given. If attendance fails to improve thereafter, dismissal is likely.
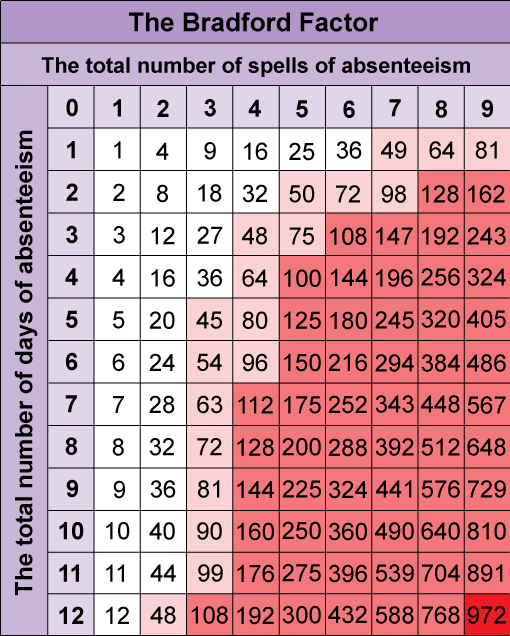
To bring the Bradford Factor to life and to further highlight when action is required, here is a chart that uses Bradford calculations.

| Key | |
|---|---|
| Action | Colour |
| No Concern | White |
| Show Your Concern | Light Red |
| Consider Disciplinary | Red |
| Consider Dismissal | Bright Red |
While the Bradford Factor can be great for tracking absenteeism on an individual level, be careful when using it, as it does not take into account disabilities or recurring illnesses.
However, it is better than traditional methods of calculating absenteeism in the sense that it does protect advisors who have suffered from a freak one-off injury.
One Long Absence
For example, if an advisor is off for two months (42 days) after suffering an injury, their Bradford Score would look like this:
Nine Short Absences
However, if an advisor has nine short absences that total to an overall period of 12 days off, their Bradford Score would be much higher, even though they have taken fewer days off in total, as shown below:
This shows the value of calculating absenteeism using the Bradford Factor, as advisors who suffer from freak injuries will not suffer from the same negative consequences as someone who repeatedly takes time off.
For those with a disability – which may impact attendance – or a recurring illness, make sure it is documented, so they are allowed greater leniency with their scores.
3 Mistakes to Avoid When Calculating Absenteeism
When calculating absenteeism there are a number of mistakes that contact centres make, which can lead to inaccurate insights. Let’s take a look at three such mistakes.
1. Not Assessing the Impact of Absenteeism on Performance
A breakdown of monthly absence rates should be passed over to the WFM team, so they can optimise staffing calculations.
However, this shouldn’t just be the previous 12 months of absenteeism figures, but the last three years, as this will allow the resource planners to “weed out” any anomalies and account for trend.
Also, to highlight the impact that absenteeism has on efficiency, Martin Jukes recommends: “Targeting advisors on attendance rates using a scorecard, to emphasise the negative impact absence has on overall contact centre performance.”
The absenteeism scorecard could also include schedule adherence, to highlight that this is how you mostly measure productivity, as opposed to unfair measures, such as Average Handling Time (AHT) and service level.
For more on why you need at least three years’ data when forecasting/staffing, read our article: How to Forecast With Minimal Data
2. Not Doing Anything With the Percentage Absenteeism
Many contact centres calculate absenteeism as a “pat on the back” metric, if they have managed to drive it down. However, they rarely use the percentages to gain insight.
This is according to Martin, who says: “They say our absenteeism is 8% and that’s it. Absenteeism was calculated as it was something that the contact centre felt it should do, but it does nothing with the data afterwards.”
The data should be used for WFM and trend analysis, to find ways of reducing business expenses.
3. Not Thinking of Return to Work Interviews as a Quality Process
Too often return to work interviews just involve one question; “why weren’t you in?” But this conversation should be allowed to run a little longer.
As Martin says: “I don’t think that there is always a good understanding of why people have been absent. Some may say they have had a bug or a cold, but is that the real reason? Or is there something more underlying?”
The more information that can be obtained from an advisor, the more it will help when you analyse trends in absenteeism, while it also helps to reinforce the importance of “showing up”.
For more on reducing absenteeism, read these articles next:
- An Action Plan for Dealing With Absenteeism
- 46 Tips for Managing Absence
- Need to Reduce Absence in Your Contact Centre? Here’s How!
Author: Charlie Mitchell
Reviewed by: Robyn Coppell
Published On: 3rd Oct 2018 - Last modified: 27th Sep 2024
Read more about - Workforce Planning, Absenteeism, Editor's Picks, How to Calculate, Martin Jukes, Metrics


