Customer Lifetime Value (CLV) is one of the most important and least widely used metrics in customer service.
It helps to quantify the total value of a customer to the organisation.
By using the Customer Lifetime Value, you can start to get beyond the obsession with efficiency which plagues the customer service industry and look at how you can add value by extending customer lifetime.
It helps you move from looking at cost per call and helps you to see the financial benefit of reducing customer churn.
The definition of Customer Lifetime Value (CLV)
The simplest way to express Customer Lifetime Value is the total revenue (or profit) generated by a customer over the total period that they are a customer of your organisation.
Why is it important?
Customer Lifetime Value (CLV) is about maximising customer profitability over the longest possible period – in other words, keeping customers longer and reducing overall churn.
This will help streamline the business in every department – from reducing the cost of customer acquisition, to improving processes and increasing customer satisfaction scores.
The formula
The formula is calculated as:
Customer Lifetime Value = Annual Value per Customer x Number of Years the customer stays with the organisation
There are two ways to express Customer Lifetime Value: Customer Lifetime Value (Revenue) and Customer Lifetime Value (Profit).
Both are equally valid, but which one you use depends on the metric your organisation finds more valuable. For many organisations it will be profit, but for a range of other organisations it will be revenue.
- Customer Lifetime Value (Revenue) = Annual Revenue per Customer x Number of Years the customer stays with the organisation
- Customer Lifetime Value (Profit) = Annual Profit per Customer x Number of Years the customer stays with the organisation
How to work out the Annual Revenue per Customer
At a high level, it is reasonably easy to make a rough estimate of the annual revenue per customer. You simply take the total revenue and divide it by the number of customers to get the average (arithmetic mean) figure.
However, this can be overly simplistic, in that it ignores two significant factors:
-
- The revenue per customer can be very different for different product lines – This can very much distort the average figure. In this case, it would be better to work out the average per revenue per customer per product line.
- The revenue per customer can be distorted by your larger customers – A version of Pareto’s Law highlights that it is common for 80% of your revenue to come from just 20% of your customers. In this case, you may want to use revenue per customer broken down into customer groups (e.g. Key Accounts, Mid-Market, etc.).
An alternative approach would be to use the average (median) rather than the average (mean) figures. For the difference, see this article.
How to work out the Annual Profit per Customer
At a high level, it is reasonably easy to make a rough estimate of the annual profit per customer.
Simply divide the total profits of the company by the number of customers.
But once you go beyond the high-level view, it gets much more difficult to derive the profit figures.
It depends upon what costs you decide to allocate to which items. First there is the difference between gross profit and net profit, and then there are the differences between cost of sale, fixed and variable costs.
You then have to factor in the different profits from different product lines and also different customer groups.
It is at this stage that you will probably want to visit your Finance Department to get them to help you in this task. Since they will have to sign off on any numbers in any business case, you would need to get their involvement sooner rather than later.
How to calculate Customer Lifetime Duration
There are two ways to work out how long an average customer stays with your organisation.
1. Examining Customer Records
You can take a look at your customer records and record the difference in time from their first order and their last order with you.
You then take the difference between the two – this gives a lifetime for an individual customer.
You then take an average across your whole customer base to determine your average Customer Lifetime Duration.
2. Looking at churn rate
One metric that many businesses measure is the annual customer churn rate. Customer Lifetime Duration is effectively the inverse of the customer churn rate.
So Customer Lifetime Duration = 1 / Annual Customer Churn Rate
[Annual Customer Churn Rate needs to be expressed in terms of per unit rather than percent.]
For example, if you have an Annual Customer Churn Rate of 25%, the Average Customer Lifetime Duration is 1 / 25% or 1 / 0.25 = 4 years.
Now with all measurements you need to be careful with averages, as this approach tends to average down your most loyal customers.
For example, if you have 4 customers as follows:
- Customer 1 – 12 years (ongoing)
- Customer 2 – 7 years (ongoing)
- Customer 3 – 2 years (ongoing)
- Customer 4 – 1 year (leaves)
Method 1 – Examining customer records
Average customer lifetime = (12 + 7 + 2 + 1 ) / 4 = 3 years
Method 2 – Using churn rate
Churn rate = 25%
Annual customer lifetime = 1 / 0.25 = 4 years
Obviously, Method 1 (Examining customer records) returns better results, but if you have a reasonably large number of customers then method 2 (Using churn rate) will give a good approximation.
Get the Lifetime Value signed off by the Finance Department
While you could probably work out the lifetime value yourself, if you are looking to use it in an internal business case, then at some point you will need to get it signed off by the Finance Department. The Finance Department will be able to help you get a breakdown of all the figures that you need.
Worked Example – Sky TV
For some companies, it is fairly easy to get a rough idea of customer lifetime value, particularly if they publish their customer churn rate.
This article in the Guardian has provided some key metrics on Sky TV.
- Average revenue per user (ARPU), a key metric watched by analysts, has remained almost flat for the last seven quarters at £47 per month in the UK.
- The churn rate in the UK, the proportion of customers leaving Sky, dropped to a low of 10.1%, although the company recently announced price rises of up to 4%.
So the annual revenue per user per year = £47 x 12 months = £564 per year
The customer lifetime = 1 / Churn rate = 1 / (0.105) = 9.52 years
[Note that customer churn rate needs to be expressed as a per unit 0.105 rather than as a percentage. i.e. 10.5 divided by 100]
So the Customer Lifetime Revenue = £564 x 9.52 = £5,371
This is a big number!
On average, what is a customer’s lifetime value?
The average customer lifetime value in the contact centre industry is £1,000
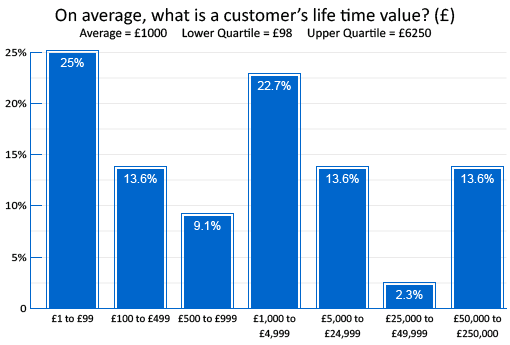
In spring 2016 Call Centre Helper carried out a survey of 351 contact centre professionals. The findings revealed that the average customer lifetime value in the contact centre industry is £1,000.
However, roughly 48% of contact centres claimed that their customer lifetime value is less than £1,000 – with 25% stating their value is below £99.
13% stated a customer lifetime value of over £50,000
Meanwhile, approximately 13% of survey participants stated an average customer lifetime value of above £50,000.
It is interesting to see that a range of figures have been put forward in these findings – from pounds to thousands of pounds – suggesting that no matter what size the business, there is perceived value in calculating a customer’s lifetime value.
Only 15% of the industry know their customer’s lifetime value
Yet only 54 of the 351 people who took part in the survey submitted a valid answer to this question.
This suggests that the industry has yet to embrace the power of taking the customer’s lifetime value into the boardroom as a support for a business case – and could explain why many contact centres are still failing to deliver an exceptional customer experience.
Case Study: How to use the Customer Lifetime Value
A good example of how to use the Customer Lifetime Value came from Damian Hall, Head of Customer Service at VisionDirect.co.uk, who formerly worked at Dunelm Mill.
They were faced with a number of furniture deliveries that were being returned after being delivered.
So how much does a damaged furniture item cost? Well, there’s the cost of the calls, the cost of the infrastructure that supports the call, the cost of the re-delivery, the cost of somebody processing the re-delivery, etc.

Damian Hall
“All of a sudden, you realise the business is paying £200 for every returned furniture item and you just say ‘last week, I had 175 of them’ – all of a sudden, a bit of twitching goes on in the commercial and finance teams,” said Damian Hall.
But there is also the cost of customer churn if an unhappy customer decides to do no more business with the company.
This is where Customer Lifetime Value can be very useful.
“It took the business 3 years to agree on a Customer Lifetime Value which everyone broadly signed up to. We agreed that £6,000 is the average spend, so nobody argues with it,” continued Damian. “Whether this is absolute is less important than the fact that the business is talking about lifetime value with a consistent number attached to it.”
You’ve got to be talking the same language as the rest of the business – operational parameters mean nothing to anyone outside of the contact centre.
“Once you can play back lifetime value, you can start to get some footing. If we turn around a customer and they have spent £1,000 with us, and I know they’ll likely spend another £5,000 with us, it gets to a very big number very quickly. It also helps the colleagues handling the service recovery have a longer-term view of the customer value.
“We may not in the service world be able to physically affect the external factors, but what we can do is make sufficient noise with evidence, patterns and history that the business can’t ignore that.”
As a result, Customer Services were able to work with the rest of the business to design better packaging that would protect the furniture. Although this resulted in a higher per-unit cost, by using a combination of the cost of return and Customer Lifetime Value, the overall cost to the business was much lower.
Summary
Customer Lifetime Value (CLV) is a highly effective business metric.

Neil Boxer
It helps you puts into perspective the cost of customer service. This will help the business by focusing on the opportunities generated by good customer service (i.e. extending the lifetime of the customer rather than the endless focus on efficiency by trying to save 5% off the cost of a call).
Customers who have used it frequently find it is much easier to demonstrate the importance of good customer service and find it much easier to write compelling business cases.
With thanks to Damian Hall, Head of Customer Service at VisionDirect.co.uk, and Neil Boxer at IP Integration for providing background information on this topic.
Author: Robyn Coppell
Reviewed by: Megan Jones
Published On: 8th Jun 2016 - Last modified: 5th Feb 2024
Read more about - Customer Service Strategy, Customer Loyalty, CX, Editor's Picks, How to Calculate, IP Integration















Useful article highlighting the importance of CLV as an integral metric needed to build better business cases that makes much more ‘cents’ to your finance folk.
In essence, the CLV formula is presented as CLV = Avg Revenue per customer X Avg Tenure per customer.
I can’t help thinking that the CLV formula is missing a ‘Word of Mouth’ or ‘Referral’ factor?
Any thoughts…?
Great article, and if used correctly demonstrates the value of the Data Connectivity business for Service Providers compared to voice or mobile where customer life times can be short
Hi Hilario
You are absolutely right. The trouble however with including this additional factoring is that the numbers become more and more esoteric and less grounded in broad commercial fact.
This makes the selling this into the business as a real number potentially more challenging. If you can run with this extra complexity then great, but often simpler is more effective at building a case for those outside a service operation.
You are absolutely spot on Hilario. However, the trouble can be that the more factoring based on assumptions you include, the more it becomes esoteric and open for opinion and challenge in a broad commercial business case build.
If you can build a model that gets acceptance (probably based on an NPS data set) then I would definitely advocate the approach