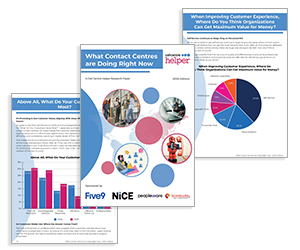


The latest What Contact Centres Are Doing Right Now (2023 Edition) report from Call Centre Helper has revealed key shifts in how technology adoption rates (for chatbots, ChatGPT, and more), channel choice, and metrics are shaping the future of the contact centre industry – as shown in the graphs below.
What Technology Is Being Used in Contact Centres?
| Contact Centre Technology | Response % |
|---|---|
| Headsets | 99.1% |
| Call Recording | 95.3% |
| ACD / Call Routing | 94.8% |
| IVR | 93.3% |
| Performance Management / Quality Monitoring | 86.2% |
| Knowledge Base | 72.3% |
| Voice of the Customer / Customer Survey | 71.3% |
| Customer Feedback Solution | 66.7% |
| Wallboards | 64.7% |
| Call Back from Queue Solution | 63.6% |
| Call Scripting | 54.9% |
| Workforce Management Software | 53.9% |
| Social Media Engagement | 52.7% |
| Desktop Consolidation | 45.4% |
| Process Automation | 43.7% |
| Proactive SMS Messaging | 37.8% |
| Chatbot | 37.5% |
| Interaction / Speech Analytics | 37.5% |
| Single Queue across All Channels | 33.4% |
| Predictive Dialler | 32.2% |
| WebRTC | 26.5% |
| Customer Service Smartphone App | 26.4% |
| Voice Biometrics | 12.4% |
| ChatGPT | 10.3% |
10% of Contact Centres Are Already Using ChatGPT
There have been some notable shifts in the use of technology since the 2022 survey findings were published.
For the first time, our What Contact Centres Are Doing Right Now (2023 Edition) survey also asked about ChatGPT – capturing a snapshot in time as to how this new technology is being adopted across the industry since its launch in November 2022.
The industry seems to be very divided at this stage, with a clear head start by early adopters – approx. 10% of the industry – embracing the challenge of deploying it, with a further 39.2% intrigued enough to have it on their wish list.
Comparably, the other half of our survey responders (50.5%) claimed not to have it – perhaps waiting to see how the early adopters fare, so they can approach this with a more cautious, considered response.
Jump in Number of Contact Centres Using Analytics
Equally significantly, the use of interaction/speech analytics has jumped from 28% of contact centre professionals using the technology in 2022 to 37.5% in 2023.
Given the level of insight and transformative power of such solutions, this is perhaps unsurprising.
This is brilliant to see, as there is much to be gained from analysing all calls and not just a handful per advisor, per month – showcasing a notable shift towards new methods of quality and performance control, as well as trouble-shooting issues such as ‘why have call volumes peaked today?’ and taking out much of the guesswork from the day-to-day running of the contact centre.
Demand for Chatbots on the Rise
The survey data also showed an increase in the number of contact centres using chatbots, up from 36% in 2022 to 37.5% in 2023.
There’s also been a positive shift in demand – with it being listed on the wish list for 38.4% of contact centres, compared to just 35.6% back in 2022.
This suggests that chatbots are becoming a more mainstream, tried-and-trusted solution, as contact centre leaders are becoming increasingly aware of the benefits of chatbots and their capability for handling simple queries with ease – freeing up agents to handle more complex customer queries.
Increasing Number of Contact Centres Making Smartphone Apps Available Too
Many more contact centres are also realizing the self-service and time-saving potential of smartphone apps too – with deployment increasing from 24.3% in 2022 to 26.4% in 2023.
There’s also more interest in this technology, with those putting it on their wish lists rising from 22.1% in 2022 to 24.4% in 2023.
As customers themselves become more comfortable with using apps in their day-to-day lives, it’s unsurprising that many contact centre professionals also see where their services and customers can benefit from this technology.
What Are the Most Important Contact Centre Metrics?
| Most Important Metric | Response % |
|---|---|
| Customer Satisfaction | 86.7% |
| Service Level | 77.8% |
| Quality Scores | 71.2% |
| First Contact Resolution (FCR) | 68.7% |
| Abandon Rate | 67.9% |
| Agent Satisfaction | 66.7% |
| Customer Complaint Volumes | 62.1% |
| Attrition Rate | 55.5% |
| Customer Effort | 50.5% |
| Schedule Adherence | 49.8% |
| Average Handling Time (AHT) | 48.4% |
| Utilization | 48.1% |
| Net Promoter Score (NPS) | 44.3% |
| Forecast Accuracy | 42% |
| Shrinkage | 41.3% |
| Occupancy | 40.8% |
| Cost Per Call | 28.4% |
| Sales Volume | 27.2% |
| NetEasy Score | 19.3% |
Top and Bottom Ranking Metrics Remain Consistent With 2022 Data
Overall, these metrics findings highlighted that contact centres across the board are very much focused on delivering a quick and high-quality service experience to their customers.
This is evident in how the 2023 survey showed a very similar picture to 2022 in the popularity of industry metrics – as Customer Satisfaction, Service Level, Quality Scores, Abandon Rate, and First Contact Resolution (FCR) all held their spots in the top 5 this year, whilst Cost Per Call, Sales Volume, and the NetEasy Score remained in the bottom 3.
Other Metrics Rising in Importance – Including NPS and Customer Effort
However, the findings also showed quite big jumps in popularity for Customer Effort (from 44.8% in 2022 to 50.5% in 2023) and Net Promoter Score (NPS) (from 38.8% in 2022 to 44.3% in 2023), as well as notable rises in Shrinkage (from 29.8% in 2022 to 41.3% in 2023) and Schedule Adherence (40.8% in 2022 to 49.8% in 2023).
What Is Your Mix of Contact Channels?
| Contact Channel | Response % |
|---|---|
| Voice (Inbound) | 55.4% |
| Voice (Outbound) | 12.7% |
| 16.5% | |
| Live Chat | 7.2% |
| Social Media | 3% |
| Letters | 1.3% |
| SMS | 1.6% |
| Video Chat | 0.4% |
| Other | 1.9% |
Email and Video on the Decline
The survey findings showed a very similar picture year-on-year between 2022 and 2023 data in the mix of contact channels being used across the industry.
However, there were some signs of movement – including a decrease in video (down from 0.6% to 0.4%) and email (down from 17.8% to 16.5%).
This shift was accompanied by increases in SMS (up from 1.3% to 1.6%), social media (up from 2.8% to 3%), and live chat (up from 7% to 7.2%).
This is indicative of customer preferences for convenience, where they may be finding video and email slower and more cumbersome than starting up a quick conversation via SMS, social media, or live chat.
Inbound Calls Also on the Rise
Interestingly, voice (inbound) also saw a jump – from 53.5% in 2022 to 55.4% in 2023. It’s possible this reflects the greater neediness of customers in 2023, as they face the cost-of-living crisis and high inflation rates and are looking to their service providers for financial and emotional support.
Is ‘Digital Transformation’ Just Another Buzzword?
Despite these shifts across digital channels, voice still dominates the contact centre industry. This suggests that many are just paying lip service to digital transformation in their operations, and that while other channels have been adopted – including live chat, email, and social media – digital transactions have a long way to go to truly compete with voice as a channel of choice.
Which Apps Do You Use to Interact With Customers?
| App Used | Response % |
|---|---|
| 48% | |
| 28.4% | |
| Messenger | 24% |
| 26.5% | |
| 19.1% | |
| None | 37.8% |
| Other | 14.7% |
Facebook Most Popular for Interacting With Customers
Almost half of survey respondents (48%) said that they were using Facebook to interact with customers – a clear leader in the customer service game, against the other available apps, including Instagram (28.4%), Messenger (24%), Twitter (26.5%), and WhatsApp (19.1%).
Over a Third of Contact Centres Don’t Use Any Apps to Interact With Customers
By comparison, 37.8% of contact centre professionals claimed they weren’t using any apps to interact with customers.
This is possibly due to different customer preferences and demographics in play, although it may also be indicative of the nature of some industries – for example, those handling more emotive subjects such as bereavements and insurance may be more inclined to push their customers towards the phone for a more in-depth conversation.
Some Contact Centres Also Using LinkedIn, MS Teams, and Viber
Of the 14.7% who said ‘other’, the most frequently mentioned apps were LinkedIn, MS Teams, TikTok, YouTube, and Viber – with some survey respondents also claiming to be using their own in-house built apps.
To Create Your Metric Scores, How Frequently Do You Ask Customers to Complete a Post-Contact Survey?
| Post-Contact Survey Frequency | Response % |
|---|---|
| After every contact | 38.8% |
| After every (second / third / fourth) contact | 17.2% |
| We ask each customer to complete a post-contact survey around once a quarter | 11% |
| We only send out post-contact surveys at certain points across the year | 13.9% |
| We never ask customers for post-contact feedback | 19.1% |
Are Contact Centres Restricted by the Systems They Have in Place to Survey Customers?
The survey data showed a real spread of results, varying from after every contact (38.8%) to once per quarter (11%).
Whilst this may be led by management preferences and previous levels of customer engagement – on a case-by-case basis – it could also be indicative of the systems and investment different organizations have in place.
For example, those claiming to send out a survey after every contact are most likely fortunate enough to have an automated system in place to do so – whereas the 13.9% who only do it at certain points across the year may be reliant on another department (such as Marketing) to coordinate an e-blast to the wider customer data base on their behalf.
Less Than 20% Never Ask Customers for Post-Contact Feedback
Frequency aside, the data showed that asking customers to complete a post-contact survey is the norm in the industry and that only 19.1% never ask customers to do this.
Whilst initially alarming, it’s highly possible that some of these contact centres are using more advanced methods of tracking customer insights, such as interaction and speech analytics, which largely remove the need for customers to be asked ‘how was today’s call?’
Others may focus on metrics such as First Contact Resolution rates or rely on their quality teams to gauge customer sentiment, for example.
What Initiatives Do You Currently Have in the Contact Centre?
| Contact Centre Initiatives | Response % |
|---|---|
| Multiskilling Advisors | 79.8% |
| Knowledge Empowerment | 70% |
| Unpaid Leave | 68.1% |
| Social Events | 57.9% |
| Buddying Advisors | 57.8% |
| Flexible Shifts | 56.7% |
| Advisor Empowerment | 48% |
| Spot Prizes | 46.3% |
| Motivational Games | 36.3% |
| Annualised Hours / Banked Hours | 33.1% |
| Personalised Call Routing | 32.8% |
| Self-Help Customer Videos | 29.8% |
| Sales Commission | 27.5% |
Staffing Pressures Taking Focus Away From Multiskilling Agents
One of the most noticeable year-on-year trends was the drop in the number of contact centre professionals who said they are multiskilling advisors – as this has decreased from 86.7% in 2022 down to 79.8% in 2023.
This is possibly indicative of the staffing challenges the industry continues to face, leaving less time and training resource to upskill long-standing team members against the more pressing need to train new starters.
It was also interesting to see 11.8% had multiskilling advisors on their wish list, highlighting that while many see the benefit of this initiative, there are barriers to making this a reality.
The findings also revealed that unpaid leave has fallen down the league table, as it was in the #2 position last year.
This could also be symptomatic of staffing challenges, with fewer contact centres feeling able to offer unpaid leave as a top-up to paid annual leave while still meeting their service levels.
Social Events Have Yet to Recover to Pre-Covid Levels
One of the biggest industry casualties in the shift to hybrid and remote working, post-Covid, has been the drop-off of contact centre social events.
Although there has been a small year-on-year improvement (up from 56.9% to 57.9%), percentages in the 60s and 70s haven’t been seen since 2019.
This is disappointing, but possibly indicative of many contact centres still finding their feet in the new normal and making hybrid arrangements (for most) a success.
However, as 18.1% of respondents have said this is on their wish list, it does suggest that there’s a possible come-back in store as contact centres gradually restore balance.
Motivational Games Are Bouncing Back
What’s very refreshing to see, however, is the way motivational games are bouncing back to the fore, with stats jumping from 33.3% up to 36.3% – and creeping ever-closer to the 40%s that were seen pre-Covid.
This suggests that contact centre professionals have embraced the challenge of finding motivational games that suit a hybrid working environment.
It’s also great to see 34.8% of contact centre professionals having motivational games on their wish list, showing a real desire to bring this fun back into their teams – no matter where and when they work.
Is Your Call Centre Doing Enough to Support Vulnerable Customers?
| Supporting Vulnerable Customers | Response % |
|---|---|
| Yes | 55% |
| No | 18.5% |
| Don’t know | 26.5% |
Only Around Half of Contact Centres Prepared for New Consumer Duty
As of 31st July 2023, the UK’s financial regulator, the FCA, introduced a new Consumer Duty, which placed a greater emphasis on the fair treatment of vulnerable customers.
Therefore, it was reassuring to see that 55% of survey respondents felt their call centre was doing enough to support vulnerable customers.
Unfortunately, however, almost half of respondents seemed to be unaware of (26.5%) or unprepared for (18.5%) the 31st July 2023 deadline – which was very concerning given that the What Contact Centres Are Doing Right Now survey was open for responses across June and July 2023, when the deadline was imminent.
Which Barriers Stop You From Running Your Ideal Contact Centre?
| Contact Centre Barrier | Response % |
|---|---|
| Budget | 66% |
| Conflicting Business Priorities | 48.1% |
| Broken Processes | 45.2% |
| Need New Technology | 44.2% |
| IT Issues | 41.3% |
| Not Enough Staff | 36.4% |
| Not Being Aligned with Other Departments | 28.2% |
| Management Buy-In | 27.2% |
| Technology Joined Up | 23.8% |
| Lack of Skills / It’s Too Complicated for Our Existing Team | 23.3% |
| Lack of Time / Human Resources | 23.3% |
| Advisor Buy-in | 17.5% |
| Dealing With New Channels (e.g. Webchat) | 16.5% |
| Writing a Business Case | 11.2% |
| Floor Space | 9.7% |
| Wrong Advisor Targets | 7.3% |
Budget Tops the List as Biggest Barrier to Contact Centre Success
A staggering 66% of contact centre professionals said that budget is a barrier to running their ideal contact centre. However, that’s far from the be-all and end-all, with conflicting business priorities, broken processes, needing new technology, and IT issues also to blame.
Beyond this, survey respondents claimed many people-led issues to be at the heart of their woes too, with lack of skills (23.3%), lack of time (23.3%), management buy-in (27.2%), and not enough staff (36.4%) also holding them back.
Are You Likely to Leave Your Current Call Centre (by Choice) for a New Opportunity Elsewhere Within the Next 12 Months?
| Leaving in Next 12 Months | Response % |
|---|---|
| Yes | 26.6% |
| No | 48.3% |
| Unsure | 25.1% |
Only Half of Contact Centre Professionals Are Committed to Their Current Call Centre
When asked, ‘Are you likely to leave your current call centre (by choice) for a new opportunity elsewhere within the next 12 months?’, only 48.3% of survey respondents said ‘no’.
By contrast, of the other half, 26.6% said ‘yes’ and a further 25.1% said ‘unsure’ – suggesting that many contact centres are falling short in successfully engaging and retaining their frontline.
Run in partnership with Sabio, Centrical, Odigo, Scorebuddy, and NICE, this survey focused on the key elements of a contact centre, including advisor experience and engagement, artificial intelligence (AI), customer experience, quality assurance, workforce management, and more!
Related Research
To download the full copies of our ‘What Contact Centres Are Doing Right Now’ survey reports, follow the links below:
Author: Robyn Coppell
Reviewed by: Xander Freeman
Published On: 5th Jul 2024 - Last modified: 14th Jan 2026
Read more about - Contact Centre Research, Attrition, Benchmarking, Centrical, ChatGPT, Customer Feedback, Incentives, Metrics, Motivation, NiCE, Odigo, Omnichannel, Research, Reward and Recognition, Sabio, ScorebuddyCX, Trends, Vulnerable Customers