Many call centres struggle to measure performance, as easy inbound metrics, like C-SAT, may not be fully relevant.
This productivity and performance measuring guide, provided by Mats Rennstam highlights the most effective things to measure in your call centre.
Service Level Dilemma
What is easy to measure is not necessarily what is most relevant to measure.
A classic example of this is the 80/20 calls-answered service-level target that so many organisations still have, where 80% of the calls should be answered in 20 seconds.
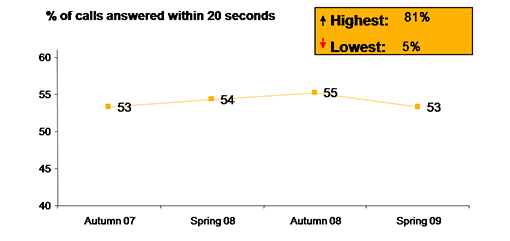
Very few centres reach this mark (the average is 55% of calls answered within 20 seconds*) and yet it persists, driven, we believe, by senior management’s desire to have one number to focus their efforts on.
Most centres genuinely believe that achievement of this service-level target is key to delivering customer satisfaction, but when measuring what the impact of a 30-second shorter hold time is, we see that it hardly affects customer satisfaction at all.
Just a small dip in FCR (First Contact Resolution) or employee engagement, however, sends customer satisfaction through the floor.
The most relevant things to measure and how
Performance
Performance, when defined as productivity, is the most common area of measurement.
Most centres measure the same things:
- abandonment rate
- hold time
- calls per agent
- calls per day, etc.
As previously mentioned, however, there is no rule book for choosing your key performance indicators (KPIs); different companies have different strategies.
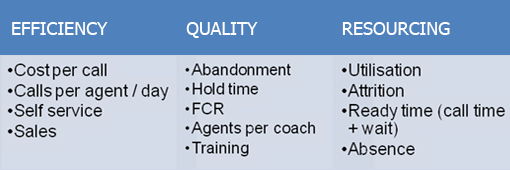
The list below shows the KPIs most high-performing centres are measuring. However, it is only when measuring employee engagement and customer satisfaction in parallel that they get the full advantage.
Call Wait Time
For example, call wait time only becomes useful as a measure when you also measure the customer satisfaction in relation to the same calls. That way you can see how far (and thus cost efficient) you are able to reduce your call wait time. That is the difference between standard performance measuring and a fuller holistic way of measuring.
Average Handling Time
Another good example is average handling time (AHT). Yes, this is a good tactical metric for managing individuals (for instance, when you want to see how you can improve sales and FCR) but it shouldn’t be a KPI because the AHT in itself doesn’t drive strategy, it drives the KPI. When we break down agents’ AHT versus sales and FCR figures we do not see a correlation; different agents have different ways of reaching higher FCR and conversion rates.
Hold Time
Contrary to what you may read in the media or remember experiencing from your last call to your telecoms provider; the average hold time is approximately one and a half to two minutes.
The problem is that during a year this fluctuates significantly and that there are a group of centres averaging 10 minutes hold time on average and it’s those experiences that we remember.
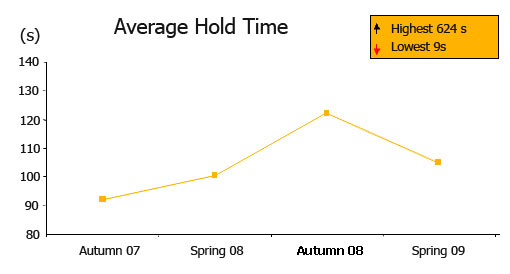
Even though we don’t see as strong an impact of this on customer satisfaction as previously thought, we do see an impact on conversion rates if the centre is up-selling.
Self Service
At the same time as you hear friends complain about endless IVR menus, in our benchmarking we see that the top performing centres have a high percentage of self-service calls.
Inbound customers like self service when it’s set up correctly and there is the option to speak to a live agent.
However, we saw a worrying trend increase from 16% to 22% of abandoned calls in self service from 2007 to 2008,* indicating that consumers are growing tired of poor scripts.
Agents per Team Leader
In search of differentiators amongst the top performers we analysed 800 reviews and saw that the centres with 8-15 agents per coach (or team leader) had a significantly better result on all of the other key metrics.* Above 15 the results dropped dramatically but under 8 the results stayed the same.
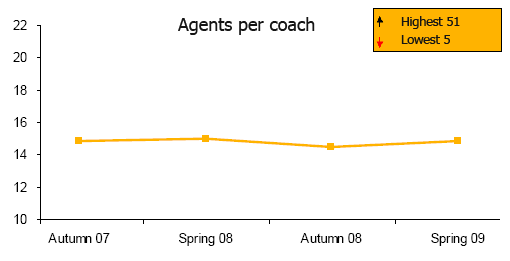
The top performers all have between 8 and 15 agents per coach. This results in:
- 10% higher ready time
- 5% higher availability
- 5% higher FCR
- Lower absence
- More satisfied agents
- Higher competency
Utilisation Level
The spread of outcome here is symptomatic of the wide range of performance levels in our industry. In 2008 the lowest utilisation level (incoming calls and talk time compared to the resources assigned to handle them) in the Bright Index benchmark was 18% and the highest 188%.
In the first case the centre has extreme over-capacity, in the latter the agents start every day knowing that they will hardly be able to handle half of the calls coming in.
Both are equally demotivating and neither is cost efficient.
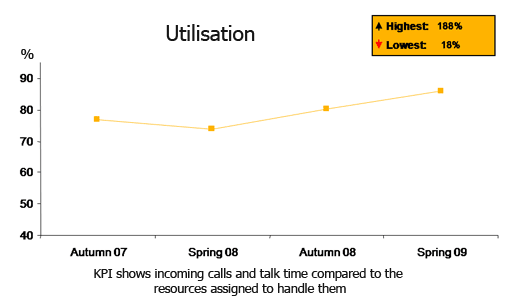
A recommended level is between 70% and 80%. At 100% we start seeing negative effects on absence and attrition (n.b. don’t mistake this metric for average talk time per agent and day which rarely goes over 70%).
Why customers call
Finally, the second area where we think the industry still isn’t getting it right is something as basic as asking why the customers call. We still see that a majority of centres don’t have an ongoing structured process for gathering the most frequent reasons for calls, and thus can’t do a proper root-cause analysis and so find themselves dealing with the same type of queries and problems over and over again.
Joining it all up
Measuring performance in parallel with employee engagement and customer satisfaction will make you feel like someone has switched on the light in a dark room.
More on this will follow in the second article in the series.
(*trends from Bright Index – Europe’s largest and most reliable bespoke benchmarking service – comprising 100 centres participating annually and 900 reviews in total.)

Mats Rennstam
Mats Rennstam is Managing Director at Bright UK Ltd
Author: Jo Robinson

9 Comments
-
I completely support the fact that a good approach is ‘Measuring performance in parallel with employee engagement and customer satisfaction.’
Can I add that these are still fairly low level measures in my view (sorry).
Surely the ultimate measure relates to the strategic purpose of the call centre?
At the end of the day, whether in the private, public or voluntary sector, it is all about adding value. Employee satisfaction and customer satisfaction are always a means to an ends, in some higher purpose. Measuring contribution towards that higher purpose is surely the ultimate measure of success.
In the private sector, all roads lead to profit and shareholder added value. In the public sector it is about maximising the value received by customers, but it is still a higher purpose, far higher than any of the measures here.
I appreciate that many service call centres don’t make the link with profit and value added. But that is a more important shortcoming to explore, than not measuring Utilisation Level etc… surely?
Sorry to sound negative about an otherwise good article.
Chris Robinson
15 Oct at 15:10
-
I would like to make a comment regarding AHT as a measure. I believe that any average is a flawed measure especially when it comes to measuing human behaviour. I understand that this meets the specific and measurable aspects of an agent target. However when an agent is working on the phones they are most likely unable to work out what their average is so they don’t know what they need to do to make their target for the day. However agents can work to a percentage of calls under a certain time and work this out quite easily. It also means they have a goal to work towards on every single call rather than trying to make up time or cut down time.
I believe that any measure of averages should go the way of the dodo and a % within target is a more acceptable level.
So if an agent takes 10 calls. 9 calls at 89 seconds. 1 call at 512 seconds. Their AHT is 131.3 seconds. However their Handle Target Percentage is 90%.
ben Duckworth
16 Oct at 02:08
-
Absolutely Chris, agree 100%. Article cut down slightly; what we see too often is centres measuring things that are easy to measure and as you point out; not KPIs that drive their strategy and bottom line. If we could focus on fewer KPIs and the ones that drive that strategy, we would see magic happen. People seem to struggle to change though, normally because of being too busy fighting fires.
Best regards
Mats
Mats Rennstam
16 Oct at 15:24
-
With all the measurement that is undertaken by contact centres, one thing that is easily forgotten is the underlying technology. Technology problems or failures are often at the root of underperformance – but as few contact centre operators specifically measure them, their impact often remains hidden.
How often have you heard the words ‘Our system is slow today’? The reason your FCR or your hold times do not meet your KPIs may not be down to agent performance, it could be that calls get dropped, your call routing isn’t working as it should or voice quality is so bad that many calls have to be abandoned.
A recent survey by the Customer Experience Foundation (http://bit.ly/1PZoxO) has shown that UK contact centres simply do not measure the customer and business impact of technology failures, which also means that they can’t take adequate precautions to avoid them.
The statistics about measurement and KPIs referenced in this article support the view that the UK call centre industry is in a state of ignorance and quite obviously prepared to go out on a limb when it comes to the customer experience.
If you don’t measure it, you can’t improve it.
Trevor Richer
19 Oct at 11:23
-
I do agree with your said “What is easy to measure is not necessarily what is most relevant to measure”
However your example of Service Level can be true if call center managers think that measuring the SL on a monthly basis will accurately reflect the performance of the Center and give insight into the customer experience. A real life example is Reported monthly performance = 86% of all calls answered in 15 seconds
And half hourly performance for the same month is dropping in certain intervals
And it’s very different to the reported monthly performance.
Also Calls per hour/day/agent is a good example of a KPI that is not objective. When agents are driven by this KPI the following should be considered:
– When over emphasized quality can suffer
– Agents can trick the system to increase their call count.
– Many of the variables that impact calls per hour are out of an agent’s control.
– What’s the agent focus; “making the number look good!”
Adherence to schedule is a measurement of how much time during an agents shift they are taking calls or available to take calls. For example if adherence is expected to be 90 percent, each agent should be able to handle 0.90 x 60 minutes or 54 minutes on average, per scheduled hour. Agents can’t control the number of calls coming in, the knowledge of the caller and the nature of their enquiry but they can control being in the right place at the right time.
Adherence to schedule is more objective
Better way to measure the center performance is the Index theory
In which you will have 4 main Indexes that reflect the overall performance and usually it is aligned with custome rand company expectations
The 4 indexes are
1- Financial Index
2- Customer Index
3- Employee Index
4- Operational or Efficiency Index
Under each index you will list the indicators that are relevant to the index
Example for financial is cost per call, cost per sale, training cost; example for customer is FCR, C-Sat; for Employees, Attrition, adherence to schedule, etc.. And for operational is Occupancy, SL, abandoned
And you can still add more indicators as appropriate whether its relevant or easy to measure
Then to assign a weight for each indicator that will reflect the results on the overall index rate
When the index rate goes up, it means that your financial measurement in case of financial index is satisfactory and no immediate action required even if one of its indicator is not doing well
And so on if index goes down.. With further drill down to its indicator you can point the reason that affects this drop that will give you a focus and quick win solution technique to raise the performance in limited time
Sorry for the long article and thanks for your thoughts that is really helpful especially when you mentioned the span of control (agent to coach) as a performance indicator
Walid Sherif
19 Oct at 14:44
-
whem measuring Service Levels, is it more common to measure the percentage of handled calls within time parameters against all Offered calls or just against overall handled calls thus increasing the LOS?
Kristian
1 Mar at 18:00
-
How can you measure a utilisation above 100%, that’s only posibble when csr are working a considerable amount of time for free……..What definition do you use?
geert
26 Apr at 11:48
-
Hello all,
I read with interest this post.
I am at my first attempt of dimensions a call center:
type:INBOUND ONLY
business: CONCIERGE SERVICE FOR PREMIUM CLIENTS OF A BANK
clients that can potentially use the service: 80 000
HOW CAN I DETERMINE HOW MANY OF THIS CLIENTS WILL USE THE SERVICE AT ANY GIVEN TIME?
IS THERE A MODEL FOR THIS?
Thanks a lot
Emanuele
24 Oct at 14:28
-
I agree with the comment that Chris makes with one exception. When the environment is a not for profit enterprise then the bottom line is not the only consideration. You can cut costs as much as you want to improve economic performance in a not for profit setting, but it wont lead to a happier customer.
Michael Herlihy
22 Nov at 22:53
Get the latest call centre and BPO reports, specialist whitepapers and interesting case-studies.

















I completely support the fact that a good approach is ‘Measuring performance in parallel with employee engagement and customer satisfaction.’
Can I add that these are still fairly low level measures in my view (sorry).
Surely the ultimate measure relates to the strategic purpose of the call centre?
At the end of the day, whether in the private, public or voluntary sector, it is all about adding value. Employee satisfaction and customer satisfaction are always a means to an ends, in some higher purpose. Measuring contribution towards that higher purpose is surely the ultimate measure of success.
In the private sector, all roads lead to profit and shareholder added value. In the public sector it is about maximising the value received by customers, but it is still a higher purpose, far higher than any of the measures here.
I appreciate that many service call centres don’t make the link with profit and value added. But that is a more important shortcoming to explore, than not measuring Utilisation Level etc… surely?
Sorry to sound negative about an otherwise good article.
I would like to make a comment regarding AHT as a measure. I believe that any average is a flawed measure especially when it comes to measuing human behaviour. I understand that this meets the specific and measurable aspects of an agent target. However when an agent is working on the phones they are most likely unable to work out what their average is so they don’t know what they need to do to make their target for the day. However agents can work to a percentage of calls under a certain time and work this out quite easily. It also means they have a goal to work towards on every single call rather than trying to make up time or cut down time.
I believe that any measure of averages should go the way of the dodo and a % within target is a more acceptable level.
So if an agent takes 10 calls. 9 calls at 89 seconds. 1 call at 512 seconds. Their AHT is 131.3 seconds. However their Handle Target Percentage is 90%.
Absolutely Chris, agree 100%. Article cut down slightly; what we see too often is centres measuring things that are easy to measure and as you point out; not KPIs that drive their strategy and bottom line. If we could focus on fewer KPIs and the ones that drive that strategy, we would see magic happen. People seem to struggle to change though, normally because of being too busy fighting fires.
Best regards
Mats
With all the measurement that is undertaken by contact centres, one thing that is easily forgotten is the underlying technology. Technology problems or failures are often at the root of underperformance – but as few contact centre operators specifically measure them, their impact often remains hidden.
How often have you heard the words ‘Our system is slow today’? The reason your FCR or your hold times do not meet your KPIs may not be down to agent performance, it could be that calls get dropped, your call routing isn’t working as it should or voice quality is so bad that many calls have to be abandoned.
A recent survey by the Customer Experience Foundation (http://bit.ly/1PZoxO) has shown that UK contact centres simply do not measure the customer and business impact of technology failures, which also means that they can’t take adequate precautions to avoid them.
The statistics about measurement and KPIs referenced in this article support the view that the UK call centre industry is in a state of ignorance and quite obviously prepared to go out on a limb when it comes to the customer experience.
If you don’t measure it, you can’t improve it.
I do agree with your said “What is easy to measure is not necessarily what is most relevant to measure”
However your example of Service Level can be true if call center managers think that measuring the SL on a monthly basis will accurately reflect the performance of the Center and give insight into the customer experience. A real life example is Reported monthly performance = 86% of all calls answered in 15 seconds
And half hourly performance for the same month is dropping in certain intervals
And it’s very different to the reported monthly performance.
Also Calls per hour/day/agent is a good example of a KPI that is not objective. When agents are driven by this KPI the following should be considered:
– When over emphasized quality can suffer
– Agents can trick the system to increase their call count.
– Many of the variables that impact calls per hour are out of an agent’s control.
– What’s the agent focus; “making the number look good!”
Adherence to schedule is a measurement of how much time during an agents shift they are taking calls or available to take calls. For example if adherence is expected to be 90 percent, each agent should be able to handle 0.90 x 60 minutes or 54 minutes on average, per scheduled hour. Agents can’t control the number of calls coming in, the knowledge of the caller and the nature of their enquiry but they can control being in the right place at the right time.
Adherence to schedule is more objective
Better way to measure the center performance is the Index theory
In which you will have 4 main Indexes that reflect the overall performance and usually it is aligned with custome rand company expectations
The 4 indexes are
1- Financial Index
2- Customer Index
3- Employee Index
4- Operational or Efficiency Index
Under each index you will list the indicators that are relevant to the index
Example for financial is cost per call, cost per sale, training cost; example for customer is FCR, C-Sat; for Employees, Attrition, adherence to schedule, etc.. And for operational is Occupancy, SL, abandoned
And you can still add more indicators as appropriate whether its relevant or easy to measure
Then to assign a weight for each indicator that will reflect the results on the overall index rate
When the index rate goes up, it means that your financial measurement in case of financial index is satisfactory and no immediate action required even if one of its indicator is not doing well
And so on if index goes down.. With further drill down to its indicator you can point the reason that affects this drop that will give you a focus and quick win solution technique to raise the performance in limited time
Sorry for the long article and thanks for your thoughts that is really helpful especially when you mentioned the span of control (agent to coach) as a performance indicator
whem measuring Service Levels, is it more common to measure the percentage of handled calls within time parameters against all Offered calls or just against overall handled calls thus increasing the LOS?
How can you measure a utilisation above 100%, that’s only posibble when csr are working a considerable amount of time for free……..What definition do you use?
Hello all,
I read with interest this post.
I am at my first attempt of dimensions a call center:
type:INBOUND ONLY
business: CONCIERGE SERVICE FOR PREMIUM CLIENTS OF A BANK
clients that can potentially use the service: 80 000
HOW CAN I DETERMINE HOW MANY OF THIS CLIENTS WILL USE THE SERVICE AT ANY GIVEN TIME?
IS THERE A MODEL FOR THIS?
Thanks a lot
I agree with the comment that Chris makes with one exception. When the environment is a not for profit enterprise then the bottom line is not the only consideration. You can cut costs as much as you want to improve economic performance in a not for profit setting, but it wont lead to a happier customer.